Here to serve the people of Montana and its livestock industry.
Animal Health Bureau
- Permits & Forms
- Brucellosis
- Brucella canis
- Feral Swine
- High Path Avian Influenza
- Johne's
- Rabies
- Trichomoniasis
- West Nile Virus
- National Poultry Improvement Program (NPIP)
- Pay for Permits Online
Helpful Links
Contact Information
Department of Livestock
Animal Health Bureau
PO Box 202001
Helena, MT 59620-2001
Email: livemail@mt.gov
FY25 Q2 Disease Reporting
Click the highlighted link below to go directly to that section.
- Brucellosis
- Brucella canis
- Johne's
- Rabies
- Trichomoniasis
- Montana Foreign Animal Disease (FAD) Investigations FY24
- Montana Reportable Diseases FY24
Brucellosis
Montana Brucellosis FY24 and FY25 YTD Comparison Tests
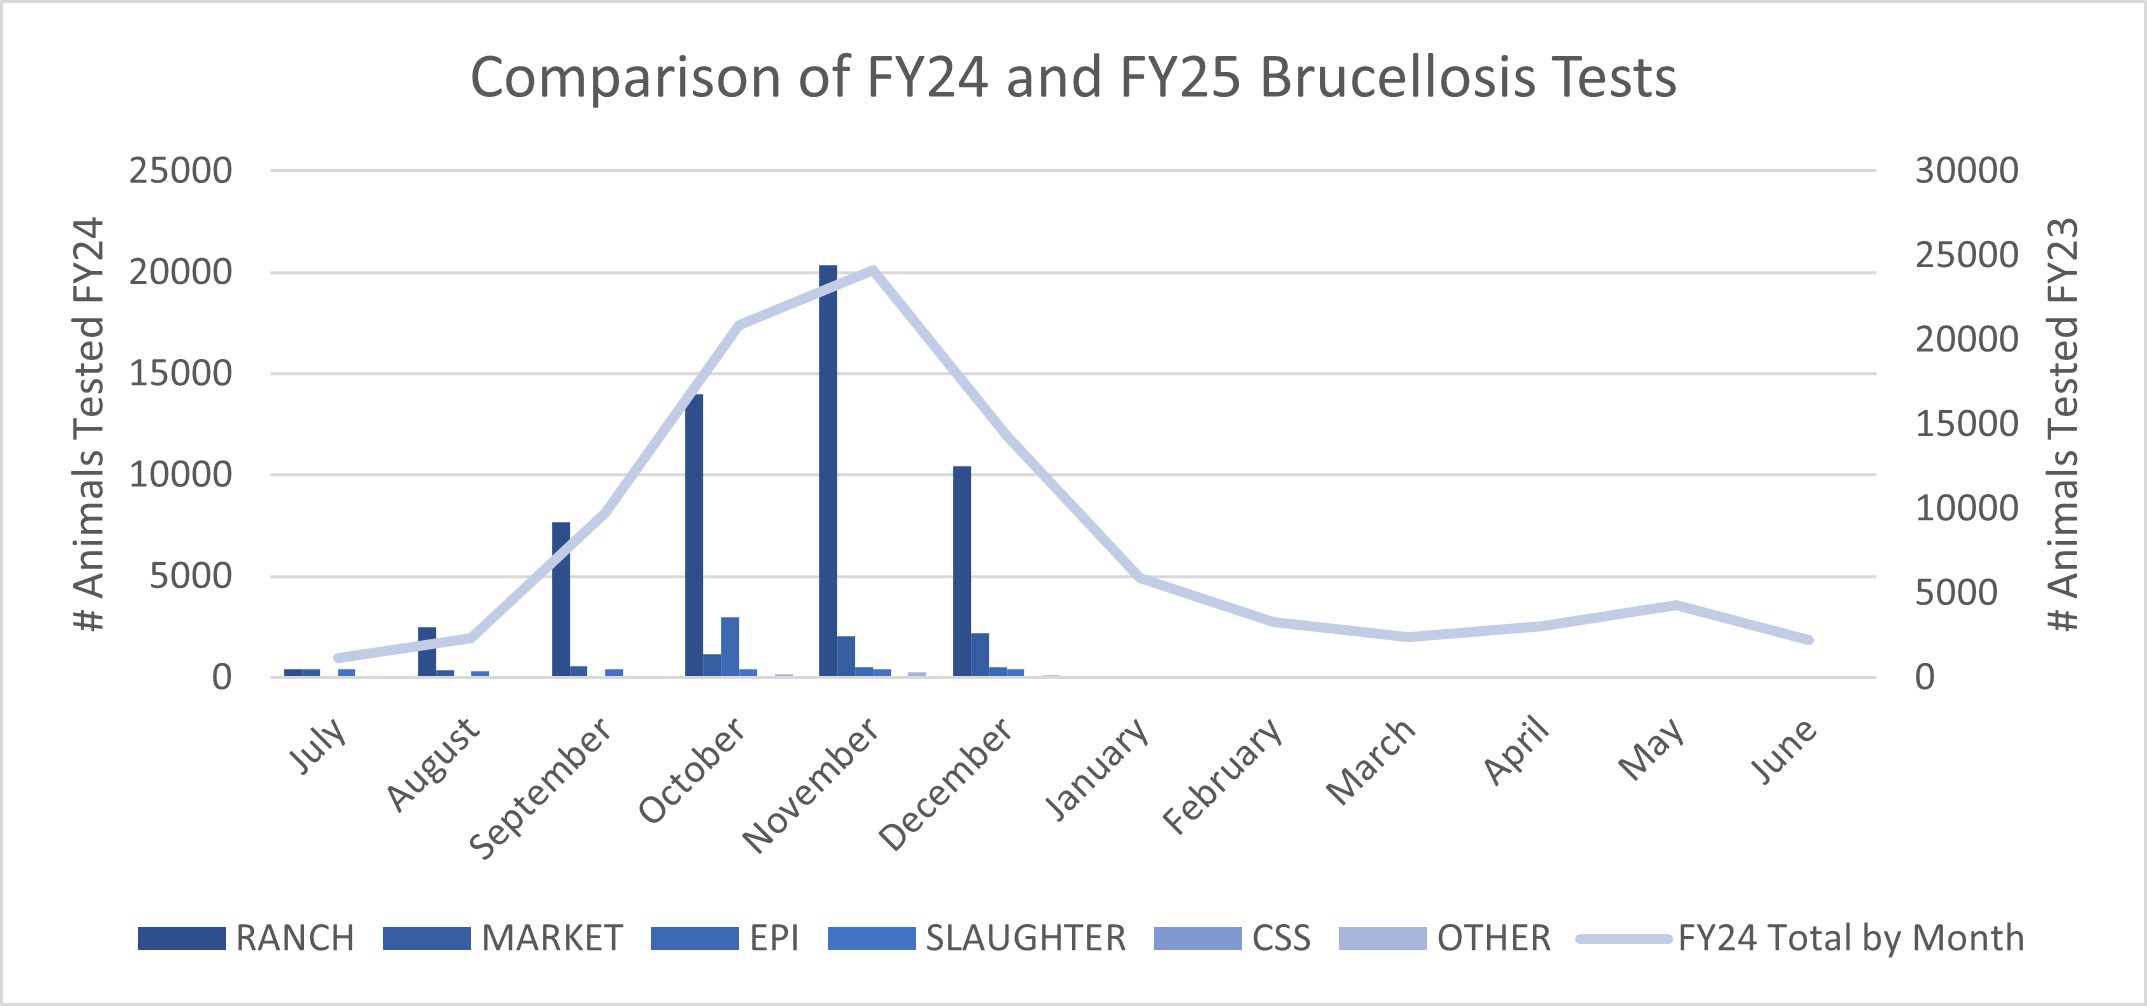
The graph above shows a comparison of the number of animals tested for brucellosis in FY24 and FY25 through Q2, with data for each month, breaking down the total number of tests by category such as Ranch, Market, Epidemiological (Epi), Slaughter, Certified Semen Service (CSS), and Other. Generally, the trend in test numbers is consistent from year to year, although test numbers for November were higher. Test numbers follow the seasonality of the cattle production cycle and are useful in predicting program expenditures.
Designated Surveillance Area (DSA) Reimbursements for Testing & Vaccination Q2
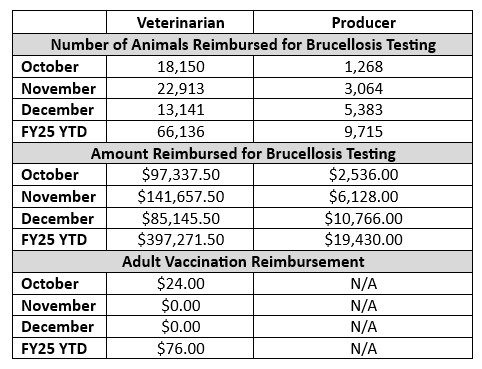
Department reimbursement for testing has helped to minimize DSA producer costs for program compliance while protecting the remainder of the state from unnecessary testing due to loss of brucellosis class status or trading partner confidence. The table above reflects reimbursements for brucellosis testing across two groups: veterinarians and producers, for the second quarter of FY25 and FY25 year to date. This data highlights the financial aspect of disease management and control efforts within the livestock industry. Funding for Montana’s brucellosis program comes from Montana General Fund and cooperative agreement funding from USDA Veterinary Services (VS).
Brucella canis (B. canis)
All data reported is from tests performed at the Montana Veterinary Diagnostic Laboratory (MVDL) and may include multiple tests for a single animal. Data includes the MVDL ELISA and IFA results, which are considered screening tests and do not confirm infection.
Montana Brucella canis (B. canis) Testing FY25 Q2
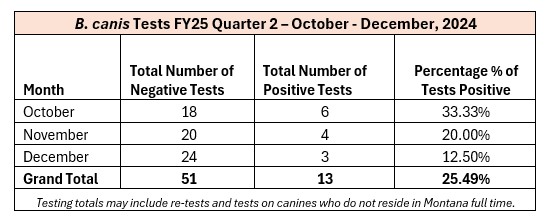
The table above summarizes the testing for Brucella canis (B. canis) conducted in Q2. It is noted that these totals may include re-tests, as well as tests conducted on canines that do not reside in Montana full-time, suggesting that the data encompasses a wider population than just the resident canines of Montana. This context indicates ongoing surveillance efforts for B. canis and provides insight into the prevalence of the disease within the tested canine population over this quarterly period.
Montana Brucella canis (B. canis) Testing by County FY25 Q2
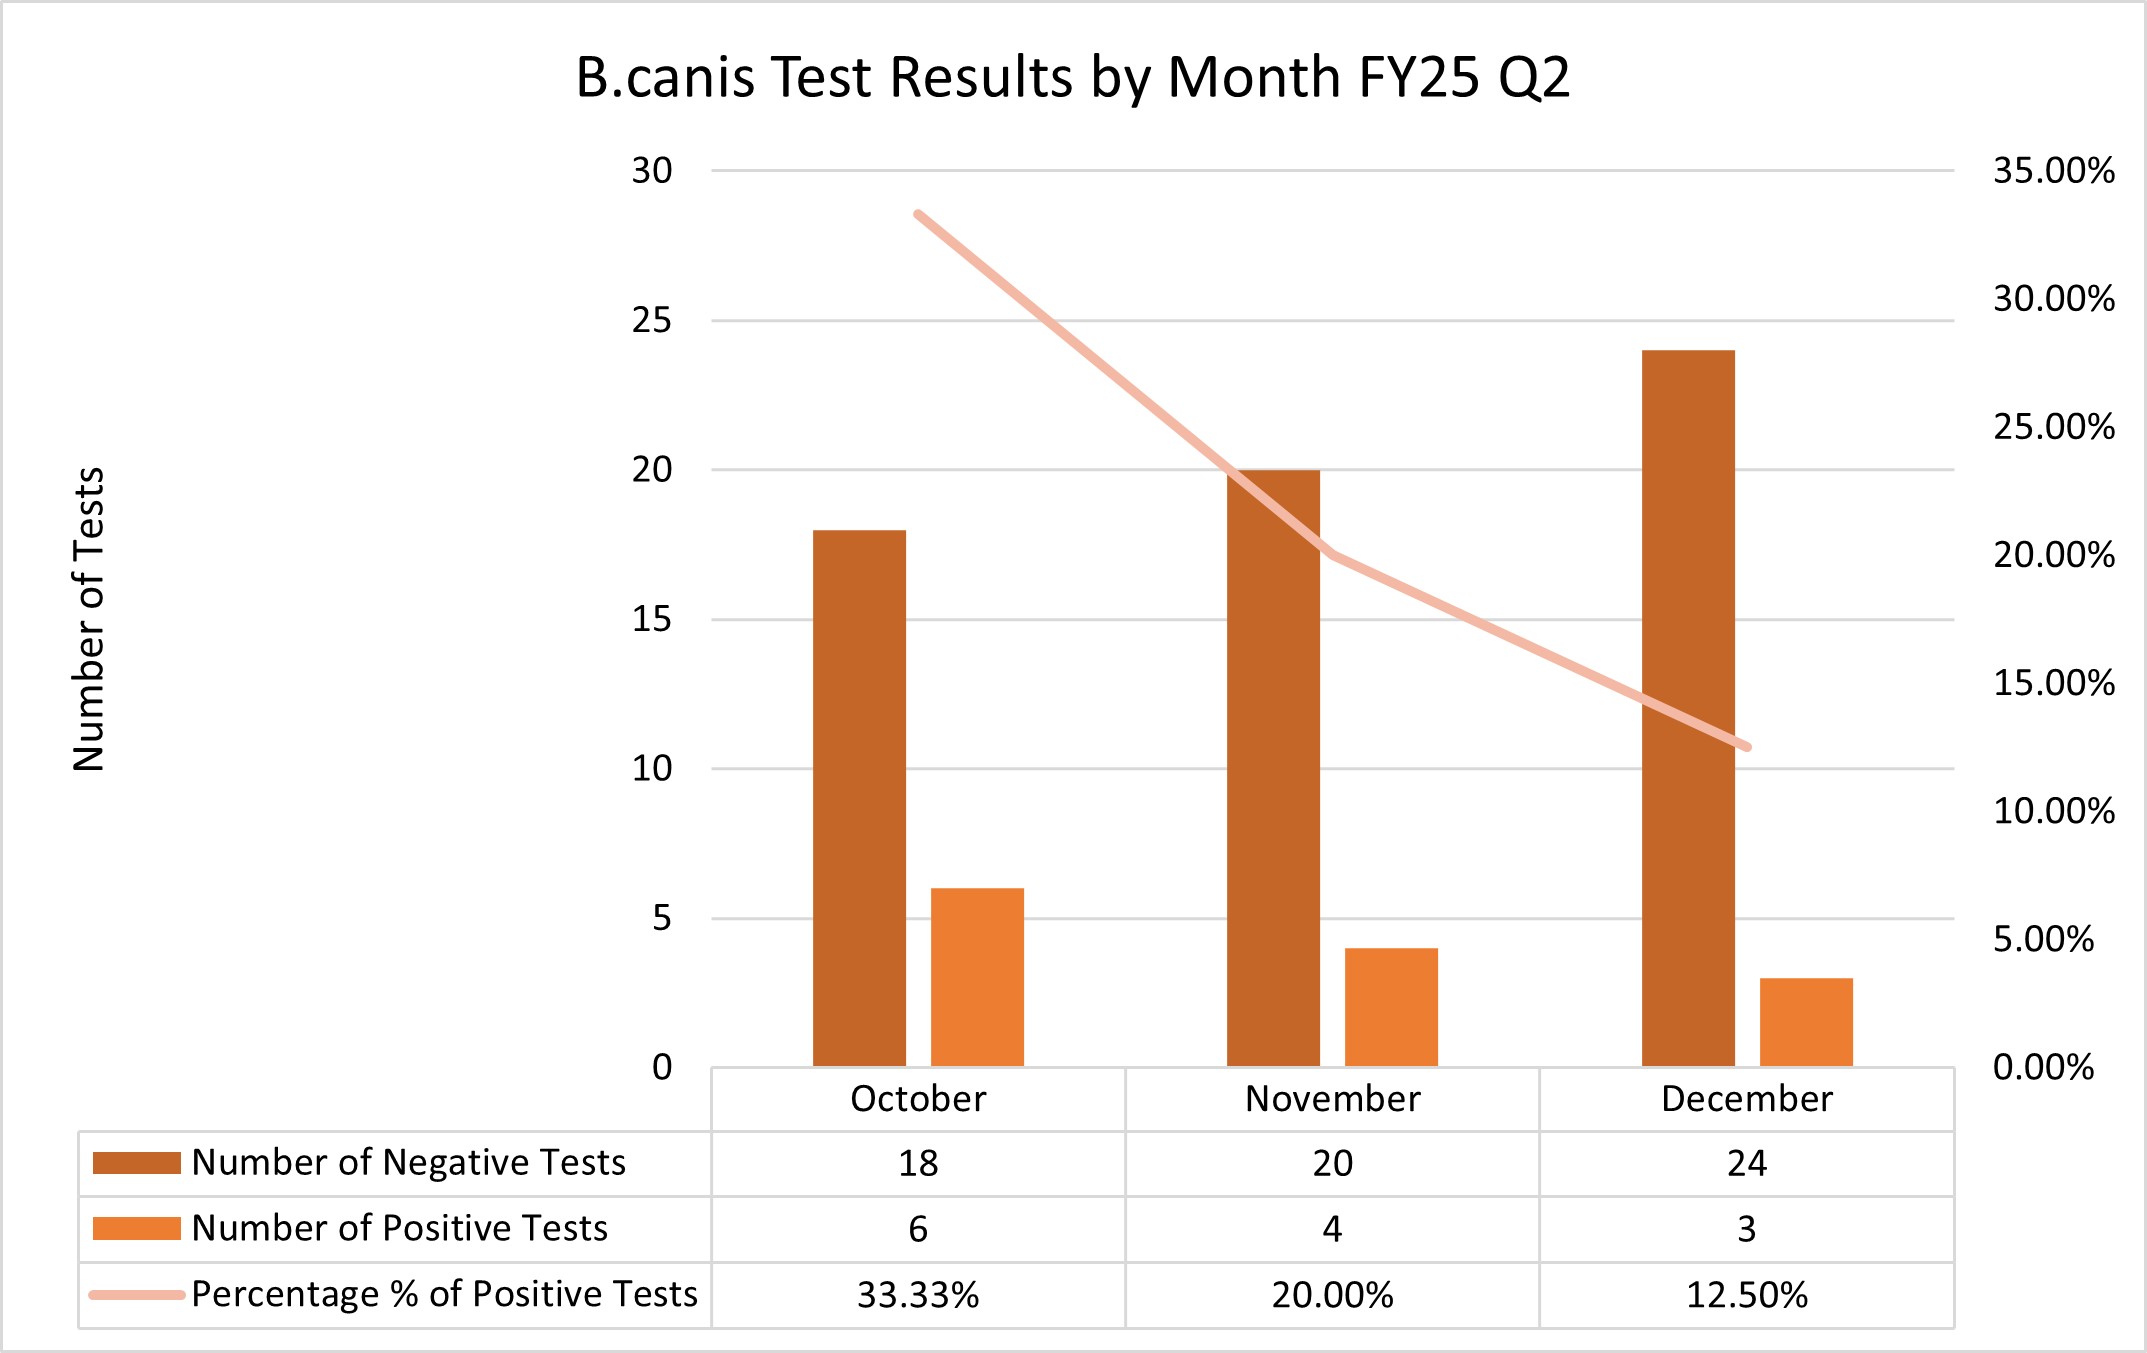
The graph above shows B. canis testing conducted in Q2. Percentage of positive tests data is also provided.
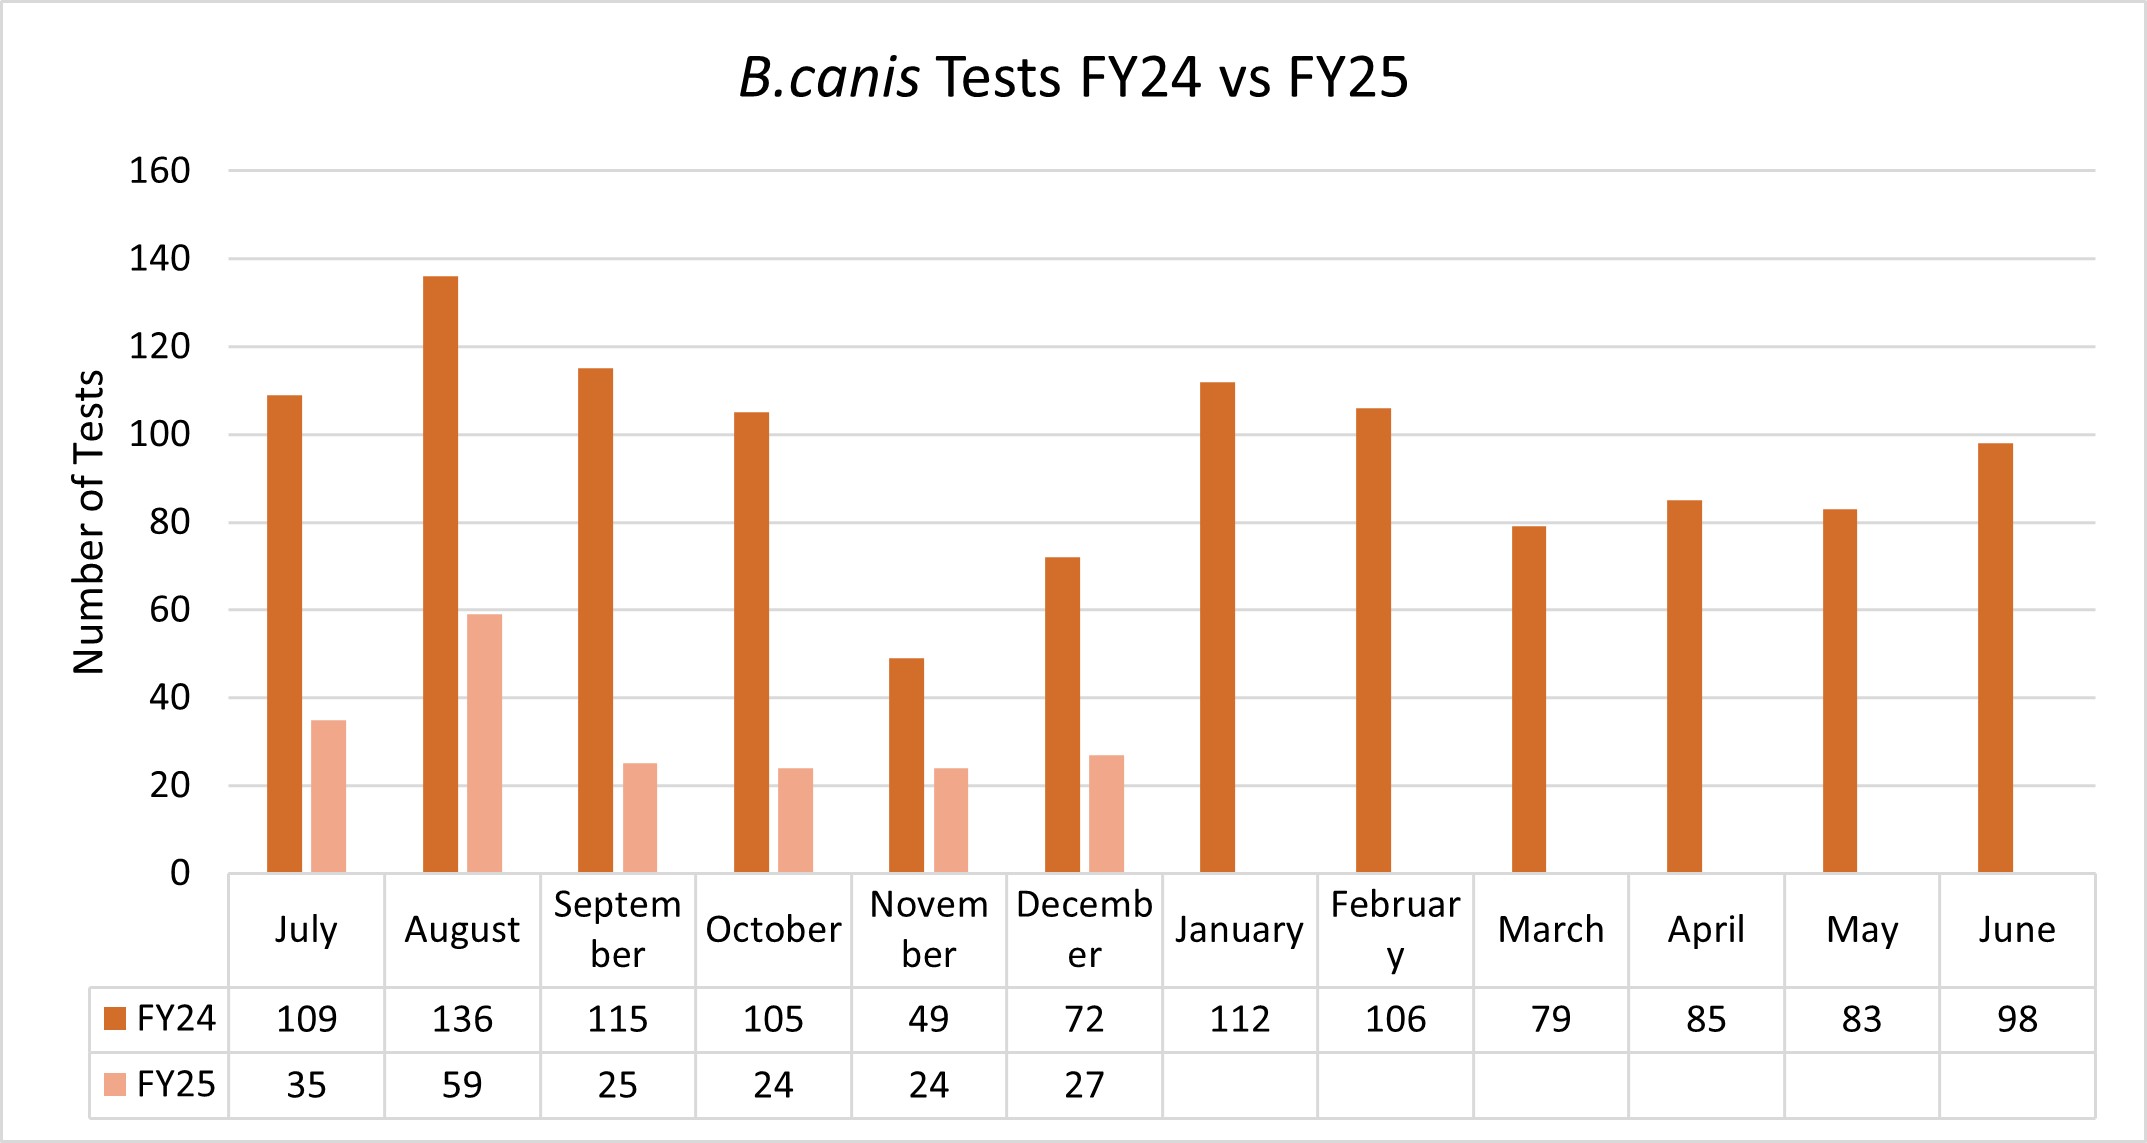
The graph above compares the number of B. canis tests conducted in FY24 and FY25 up to the current quarter. FY24 testing shows a general increase in the number of tests conducted, with a notable peak in August 2024.
Montana Brucella canis (B. canis) Testing by County FY25
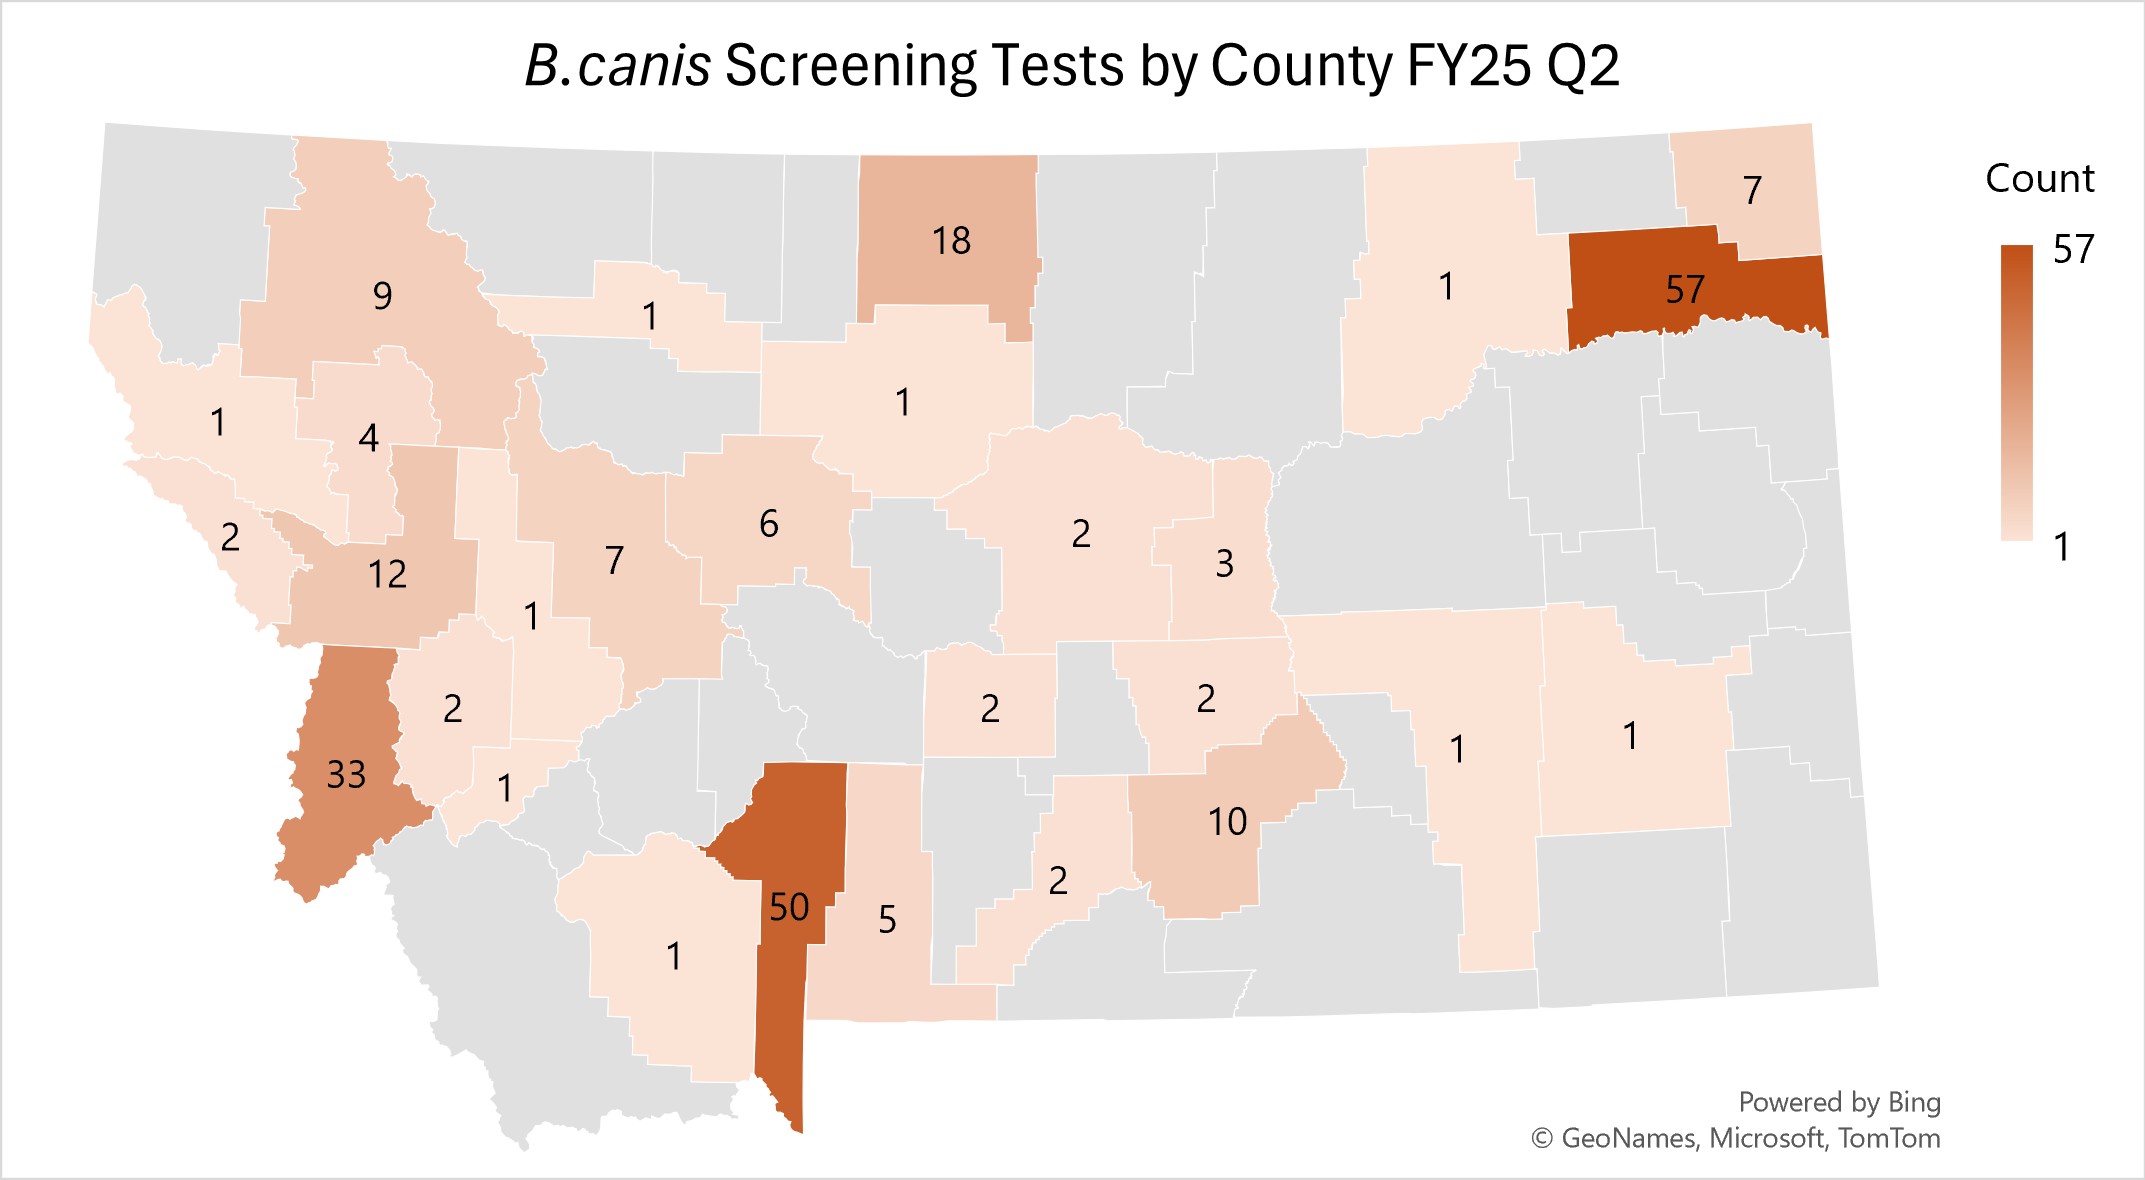
The map above illustrates the distribution of total B. canis screening tests conducted by county in FY25 Q2. The map provides a visual representation of testing efforts and may reflect a region’s focus on monitoring and controlling the spread of B. canis.
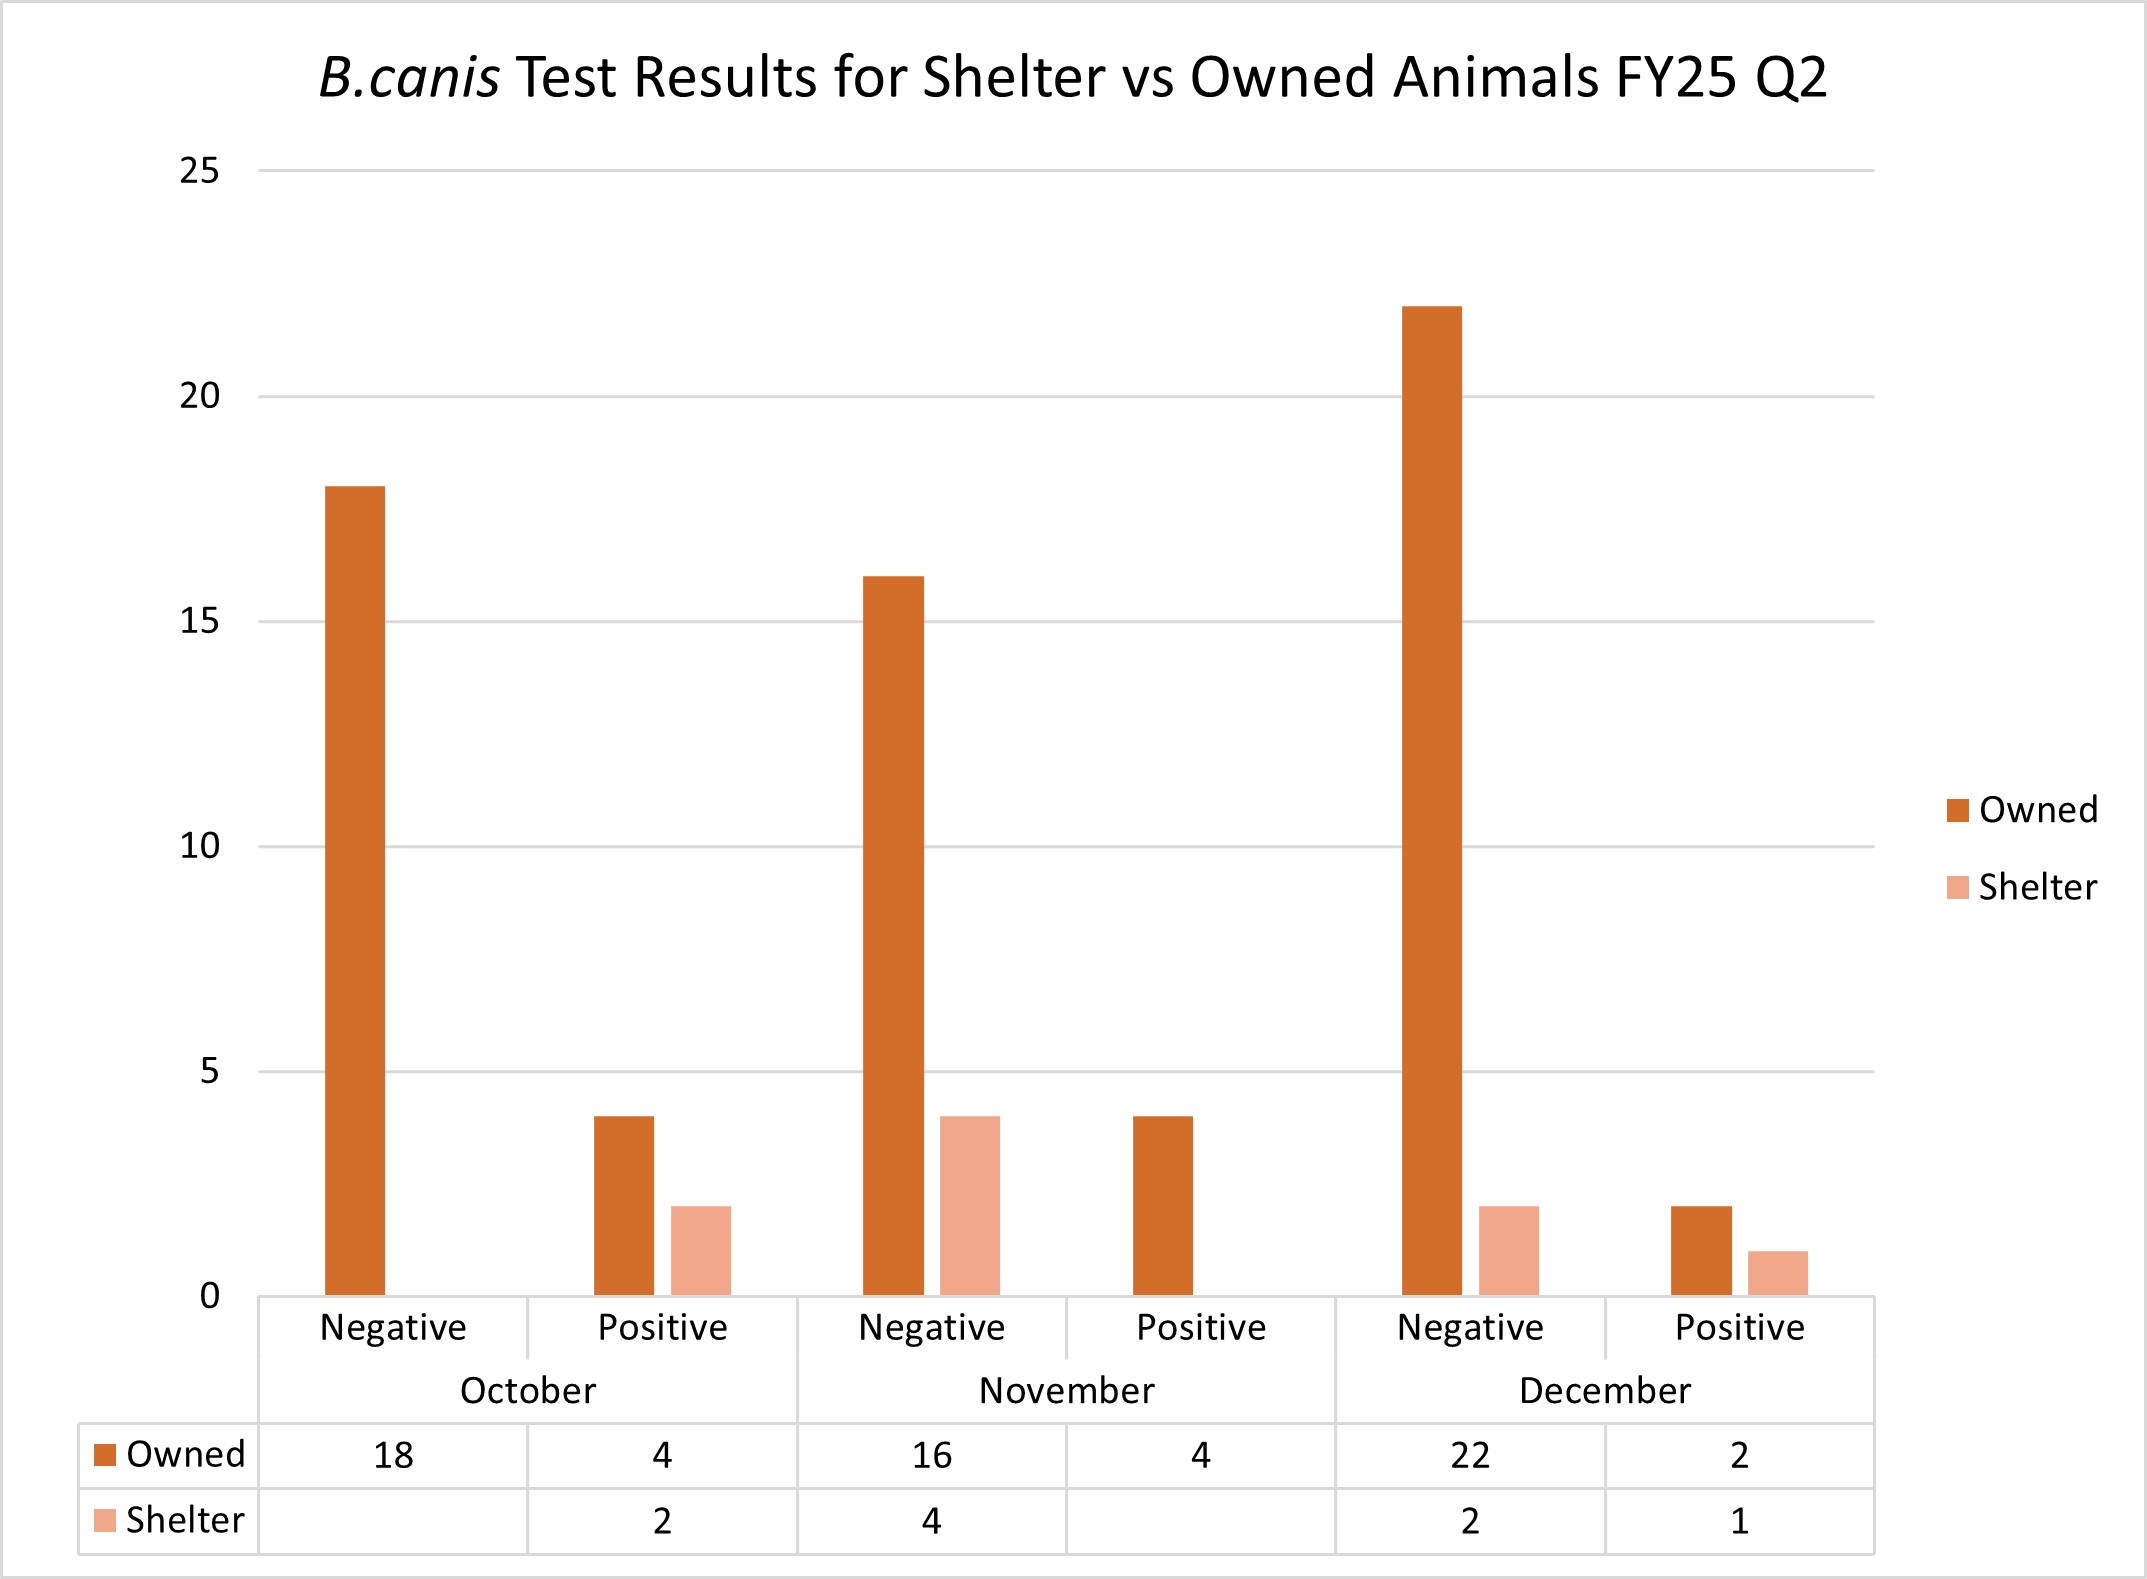
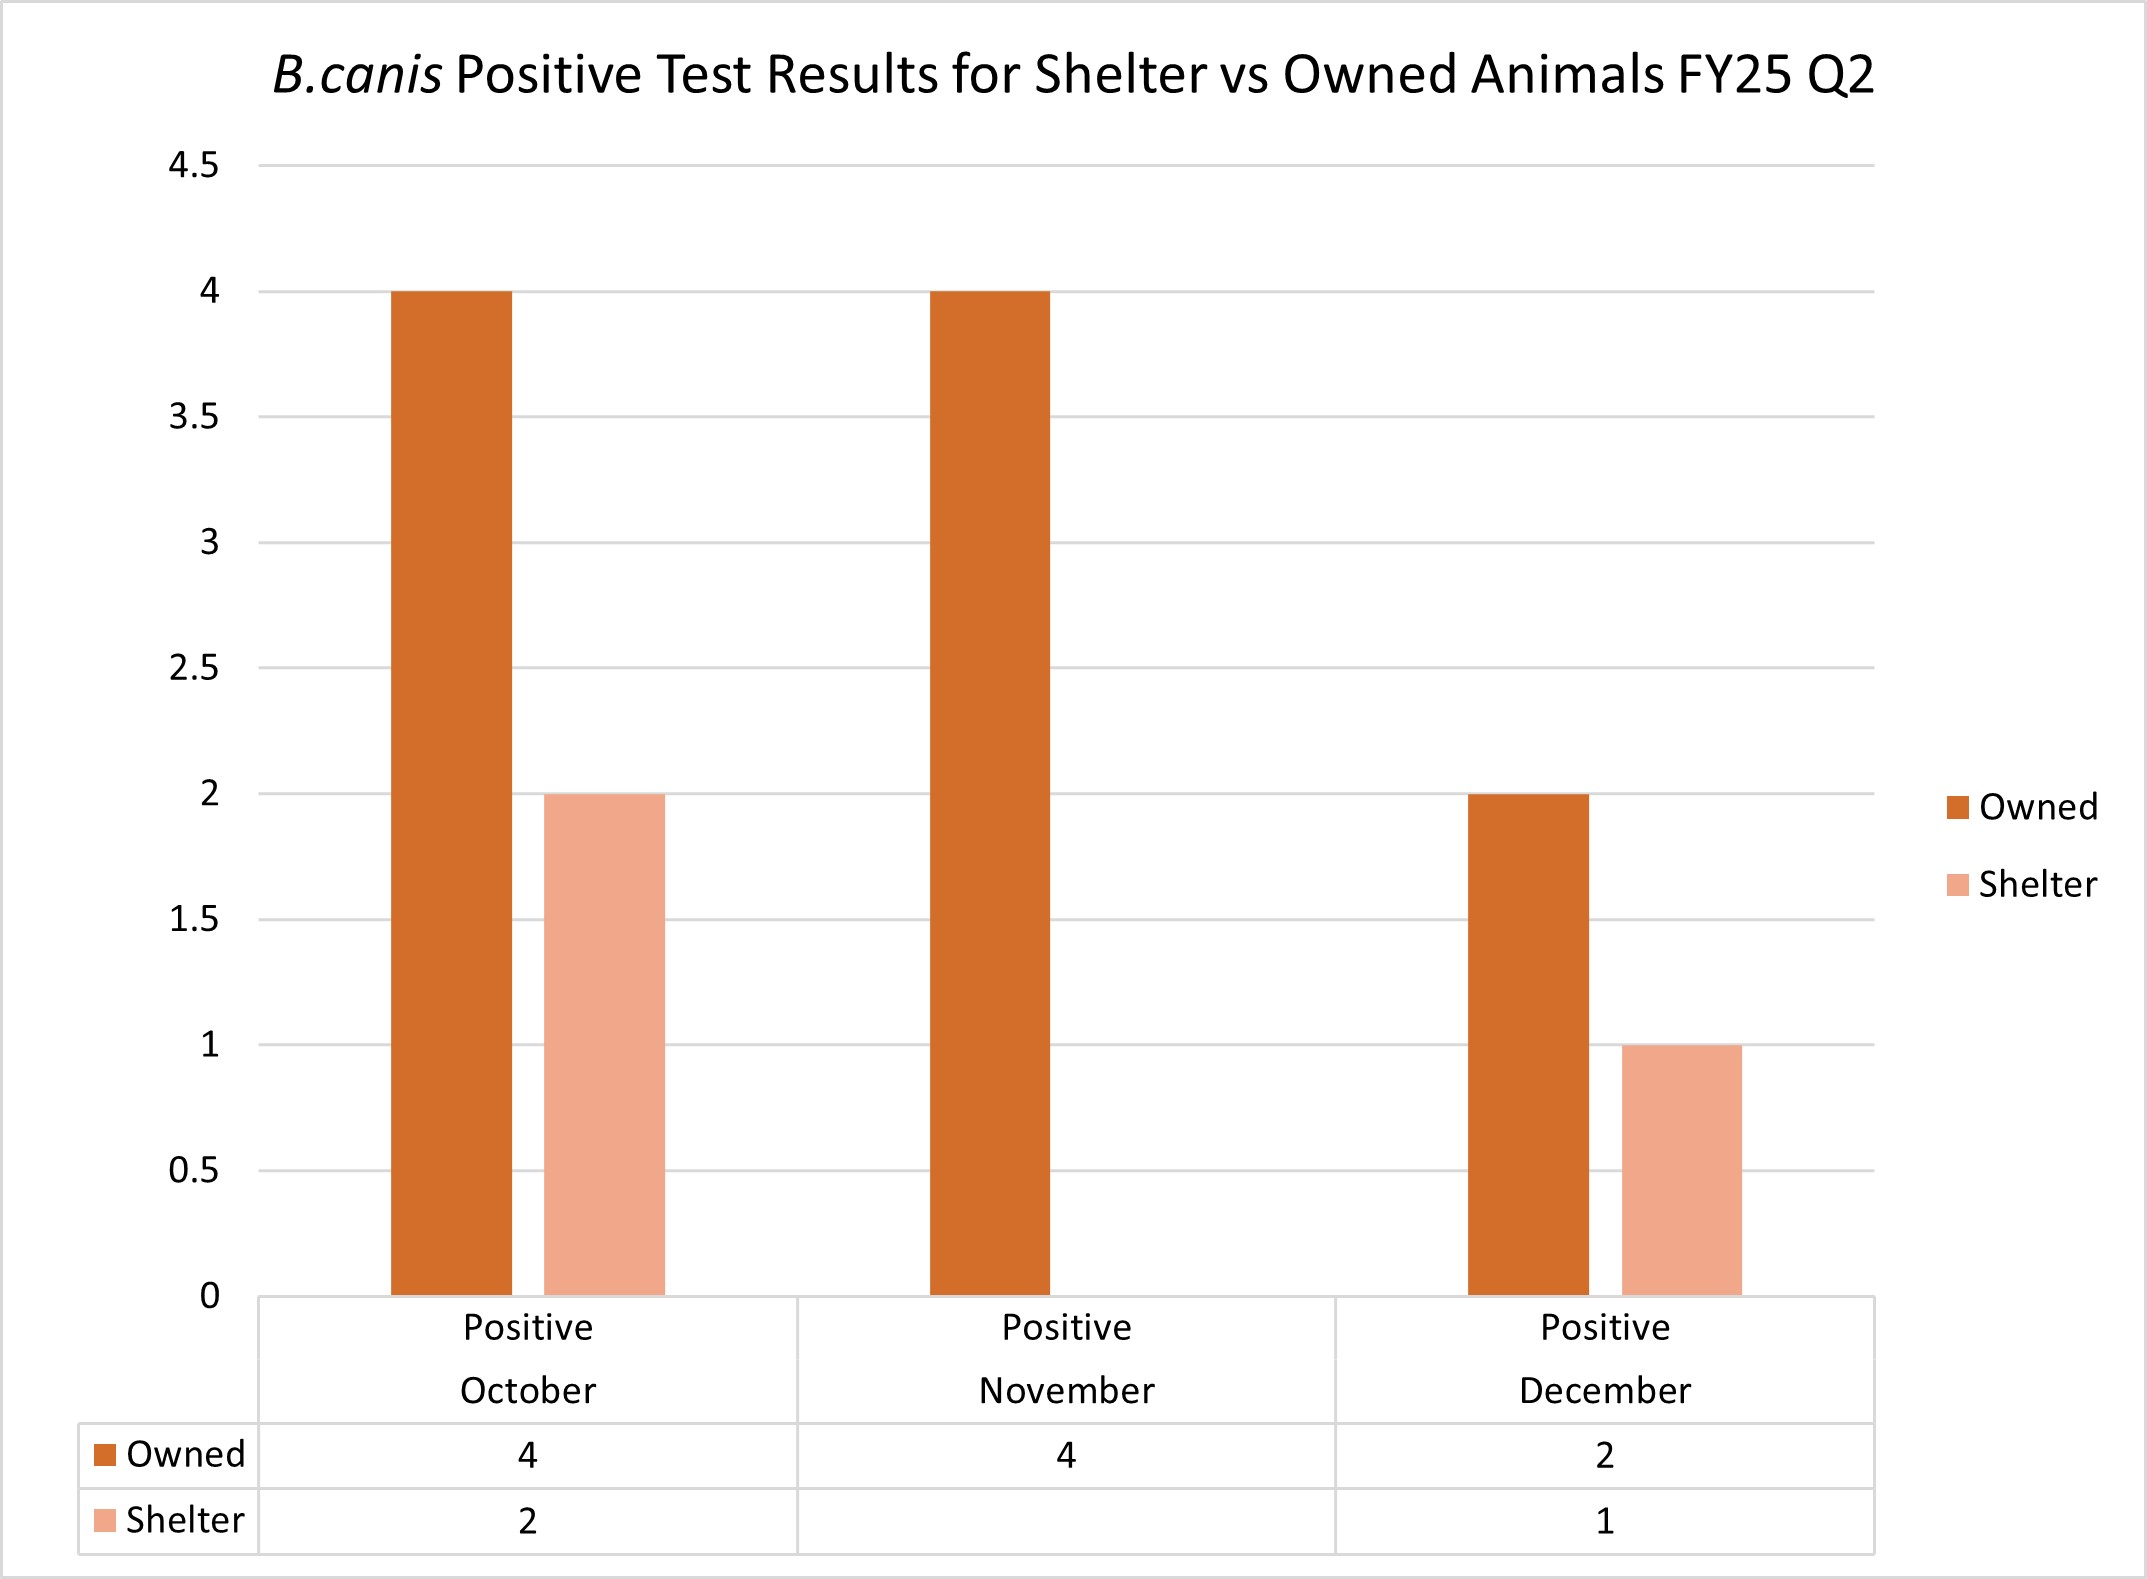
The two graphs above demonstrate the significant number of tests that are being performed through Montana animal shelters. The Department of Livestock recommends that shelter animals that have one of the designated risk factors be tested prior to adoption.
Case Definitions and Management Guidance for B. canis testing as Determined by DOL 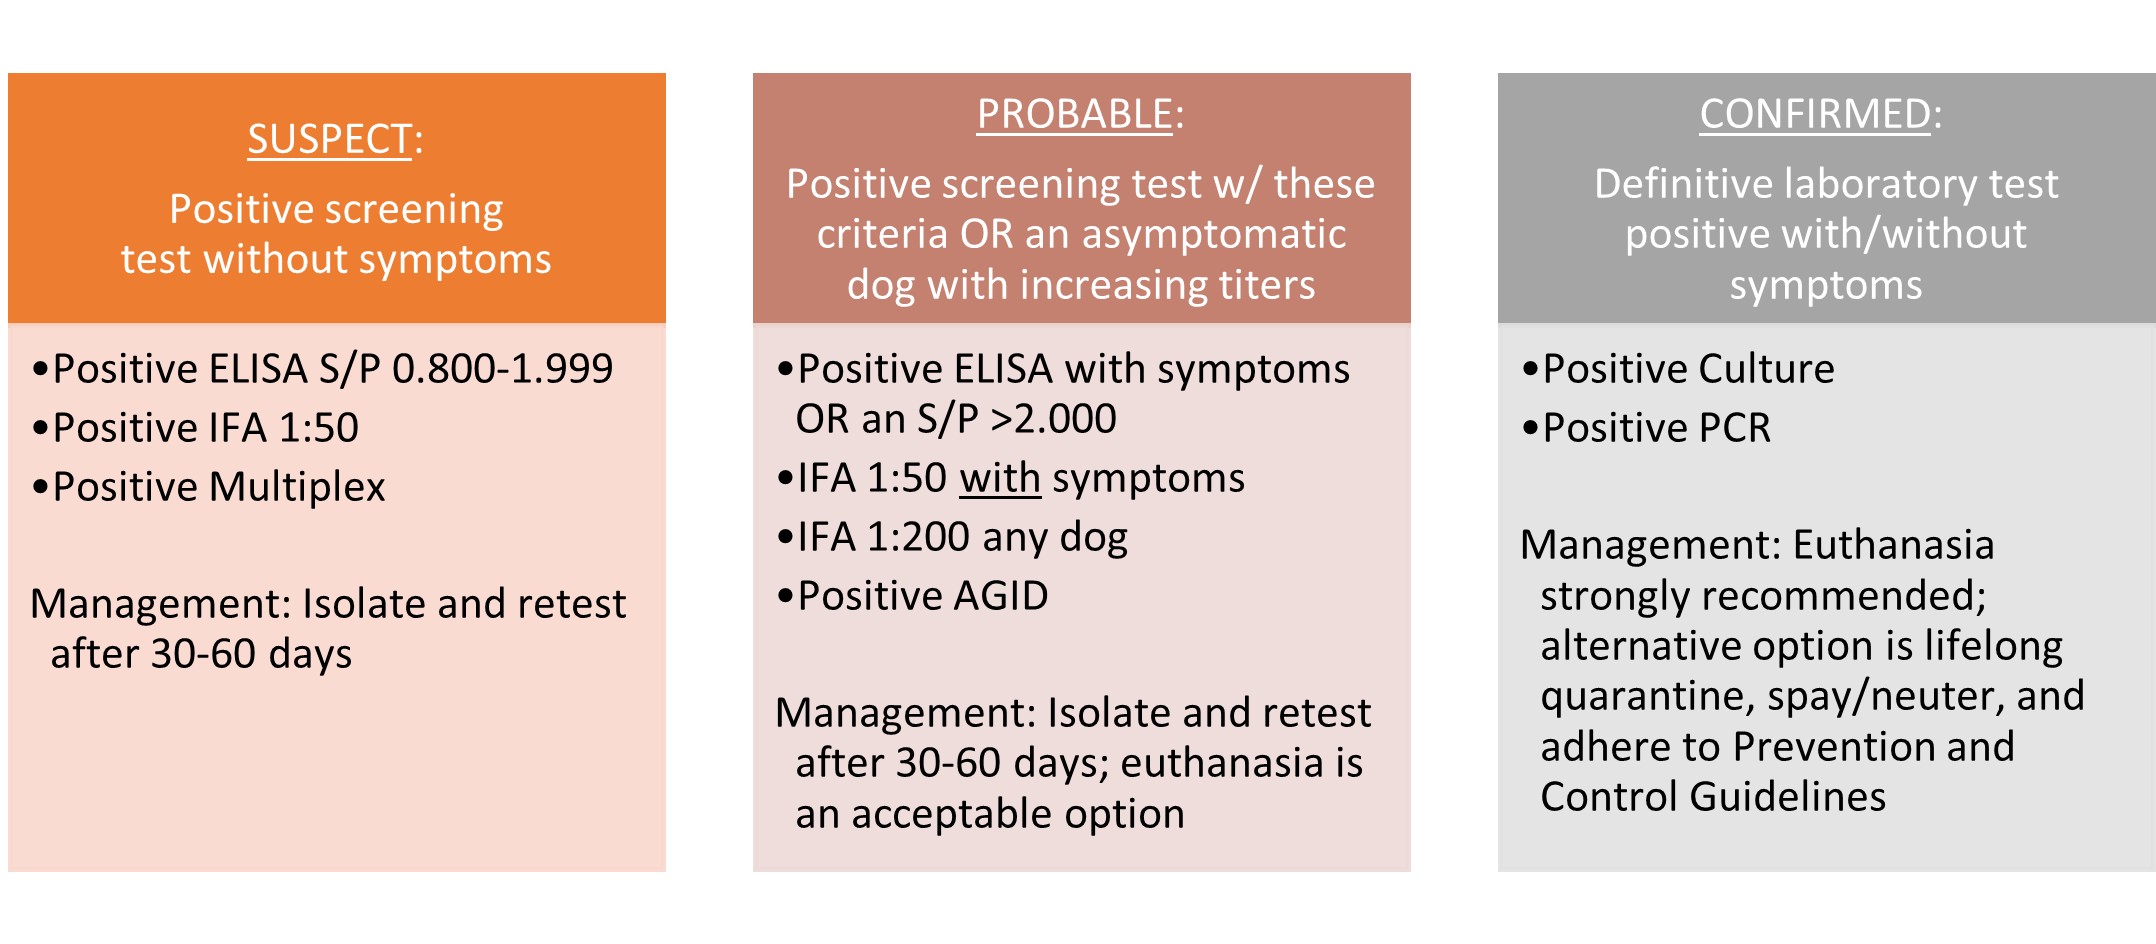
Historical Montana Brucella canis (B. canis) Testing FY17-FY24
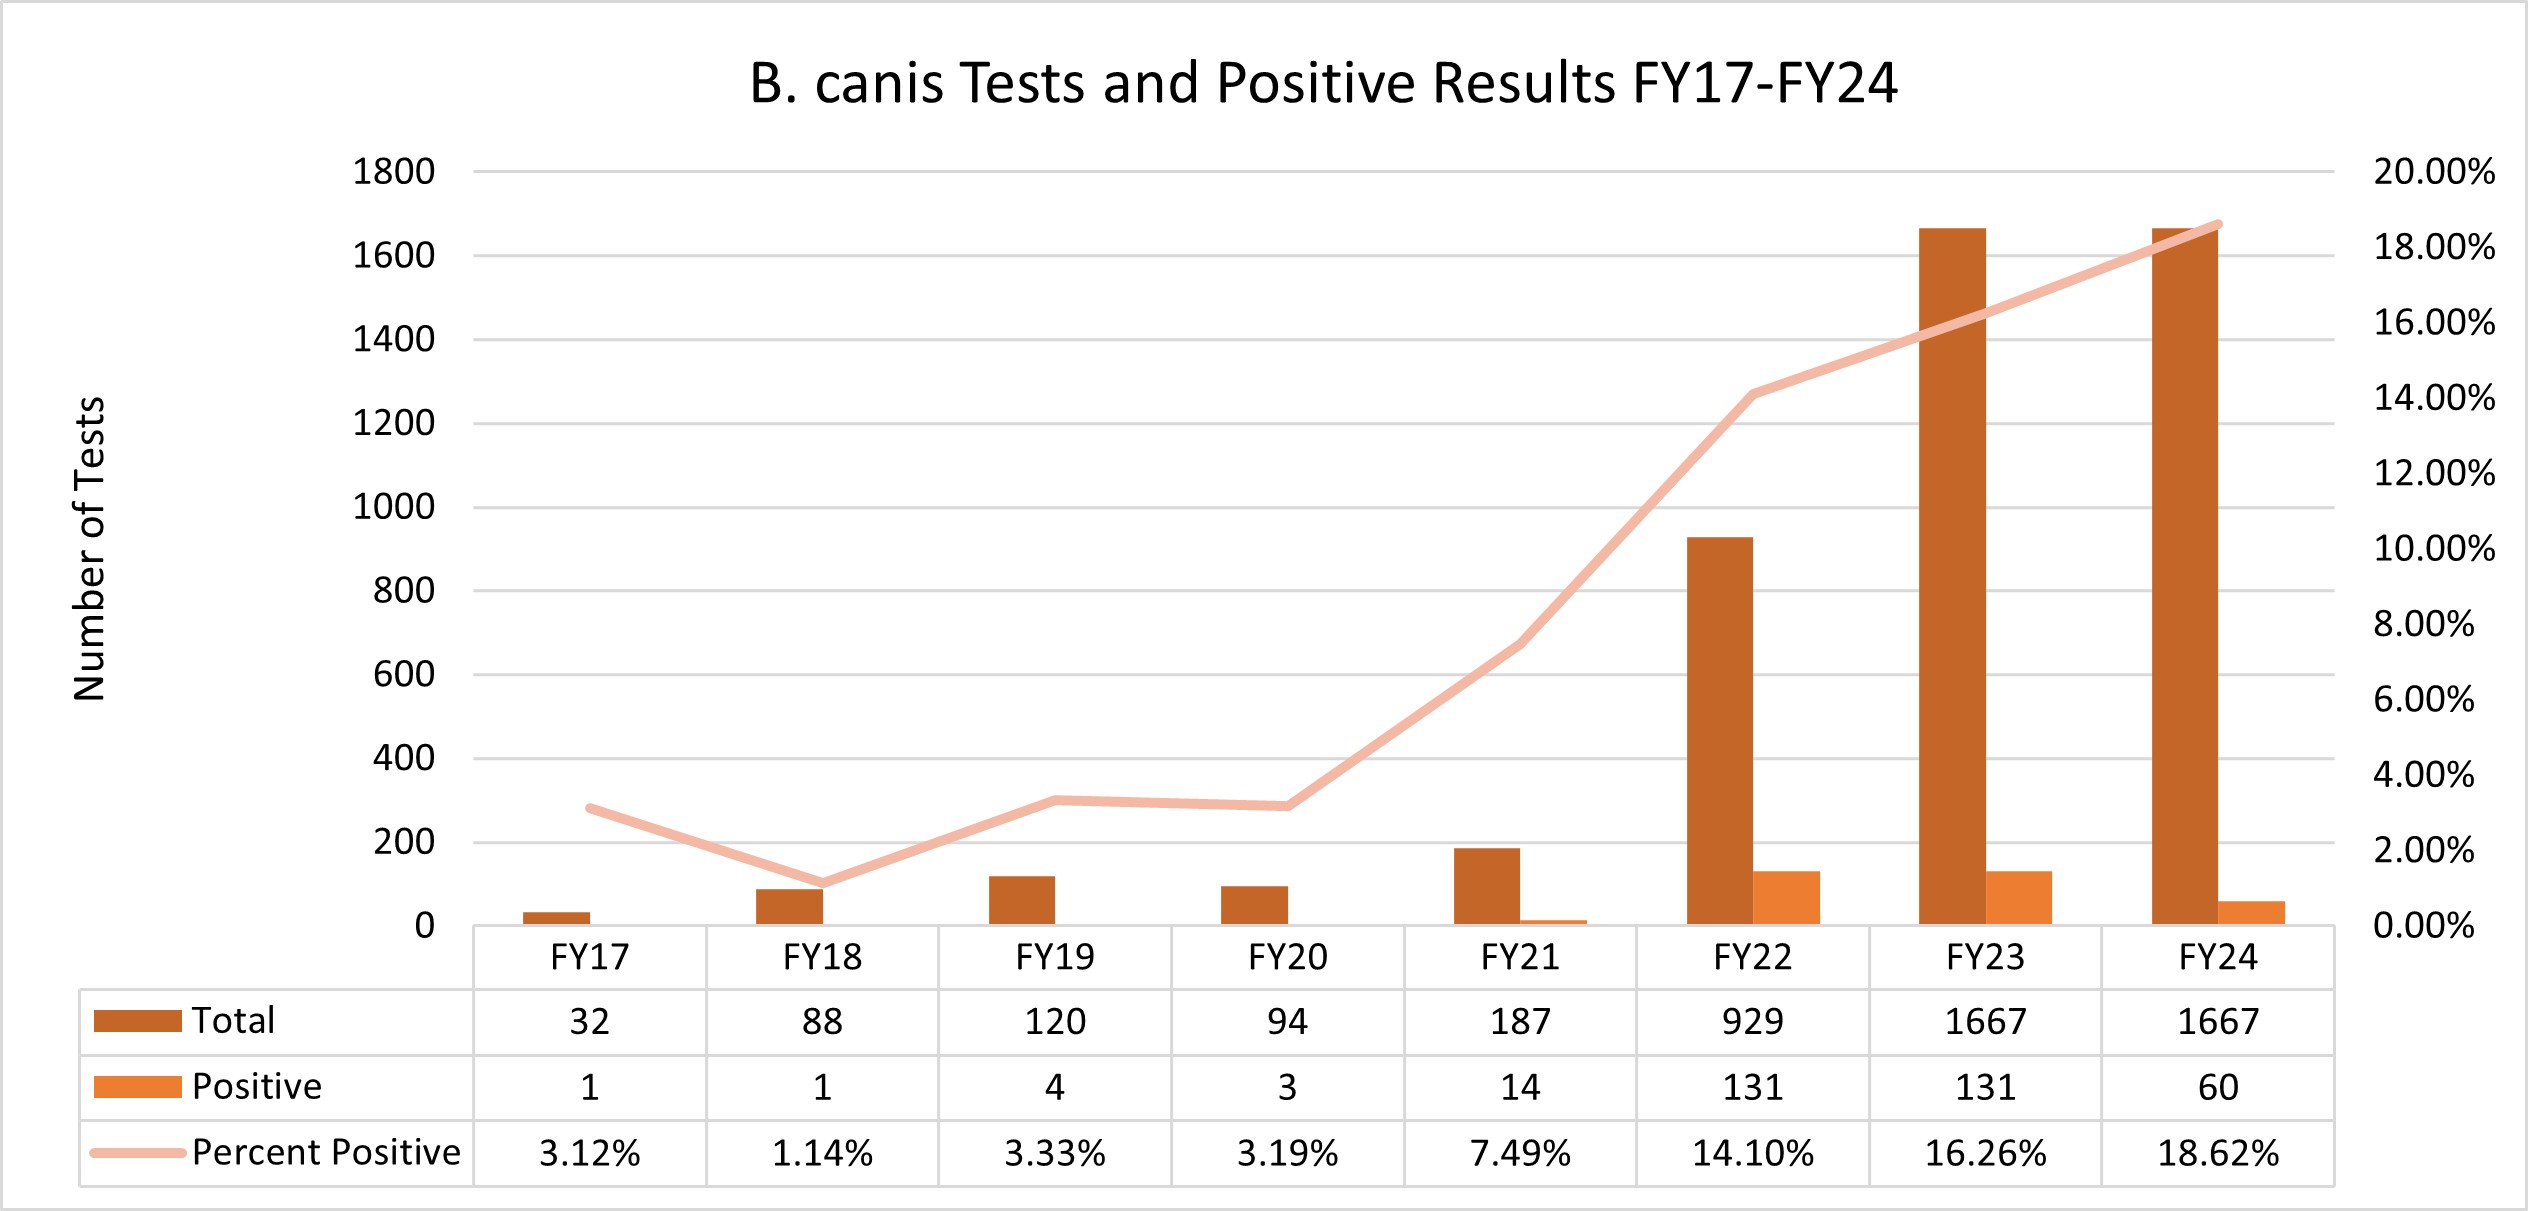
The graph above shows a steady increase in both the total number of tests conducted and the number of positive results over FY17-FY24. The percentage of positive results has also risen year over year, with a notable jump in FY21 after DOL requested increased surveillance due to concerns over increasing numbers of symptomatic and positive dogs. This trend continued in FY22-FY24 thanks to support for heightened surveillance by the Montana veterinary community. With the enhanced detection efforts, DOL has also noticed a continued increase in the percent positive rate.
Johne’s
Montana Johne’s Testing FY25 Q2
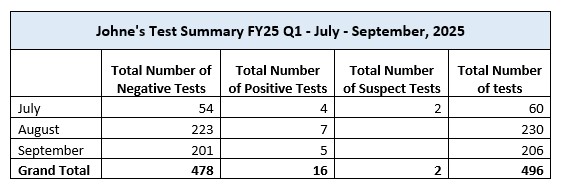
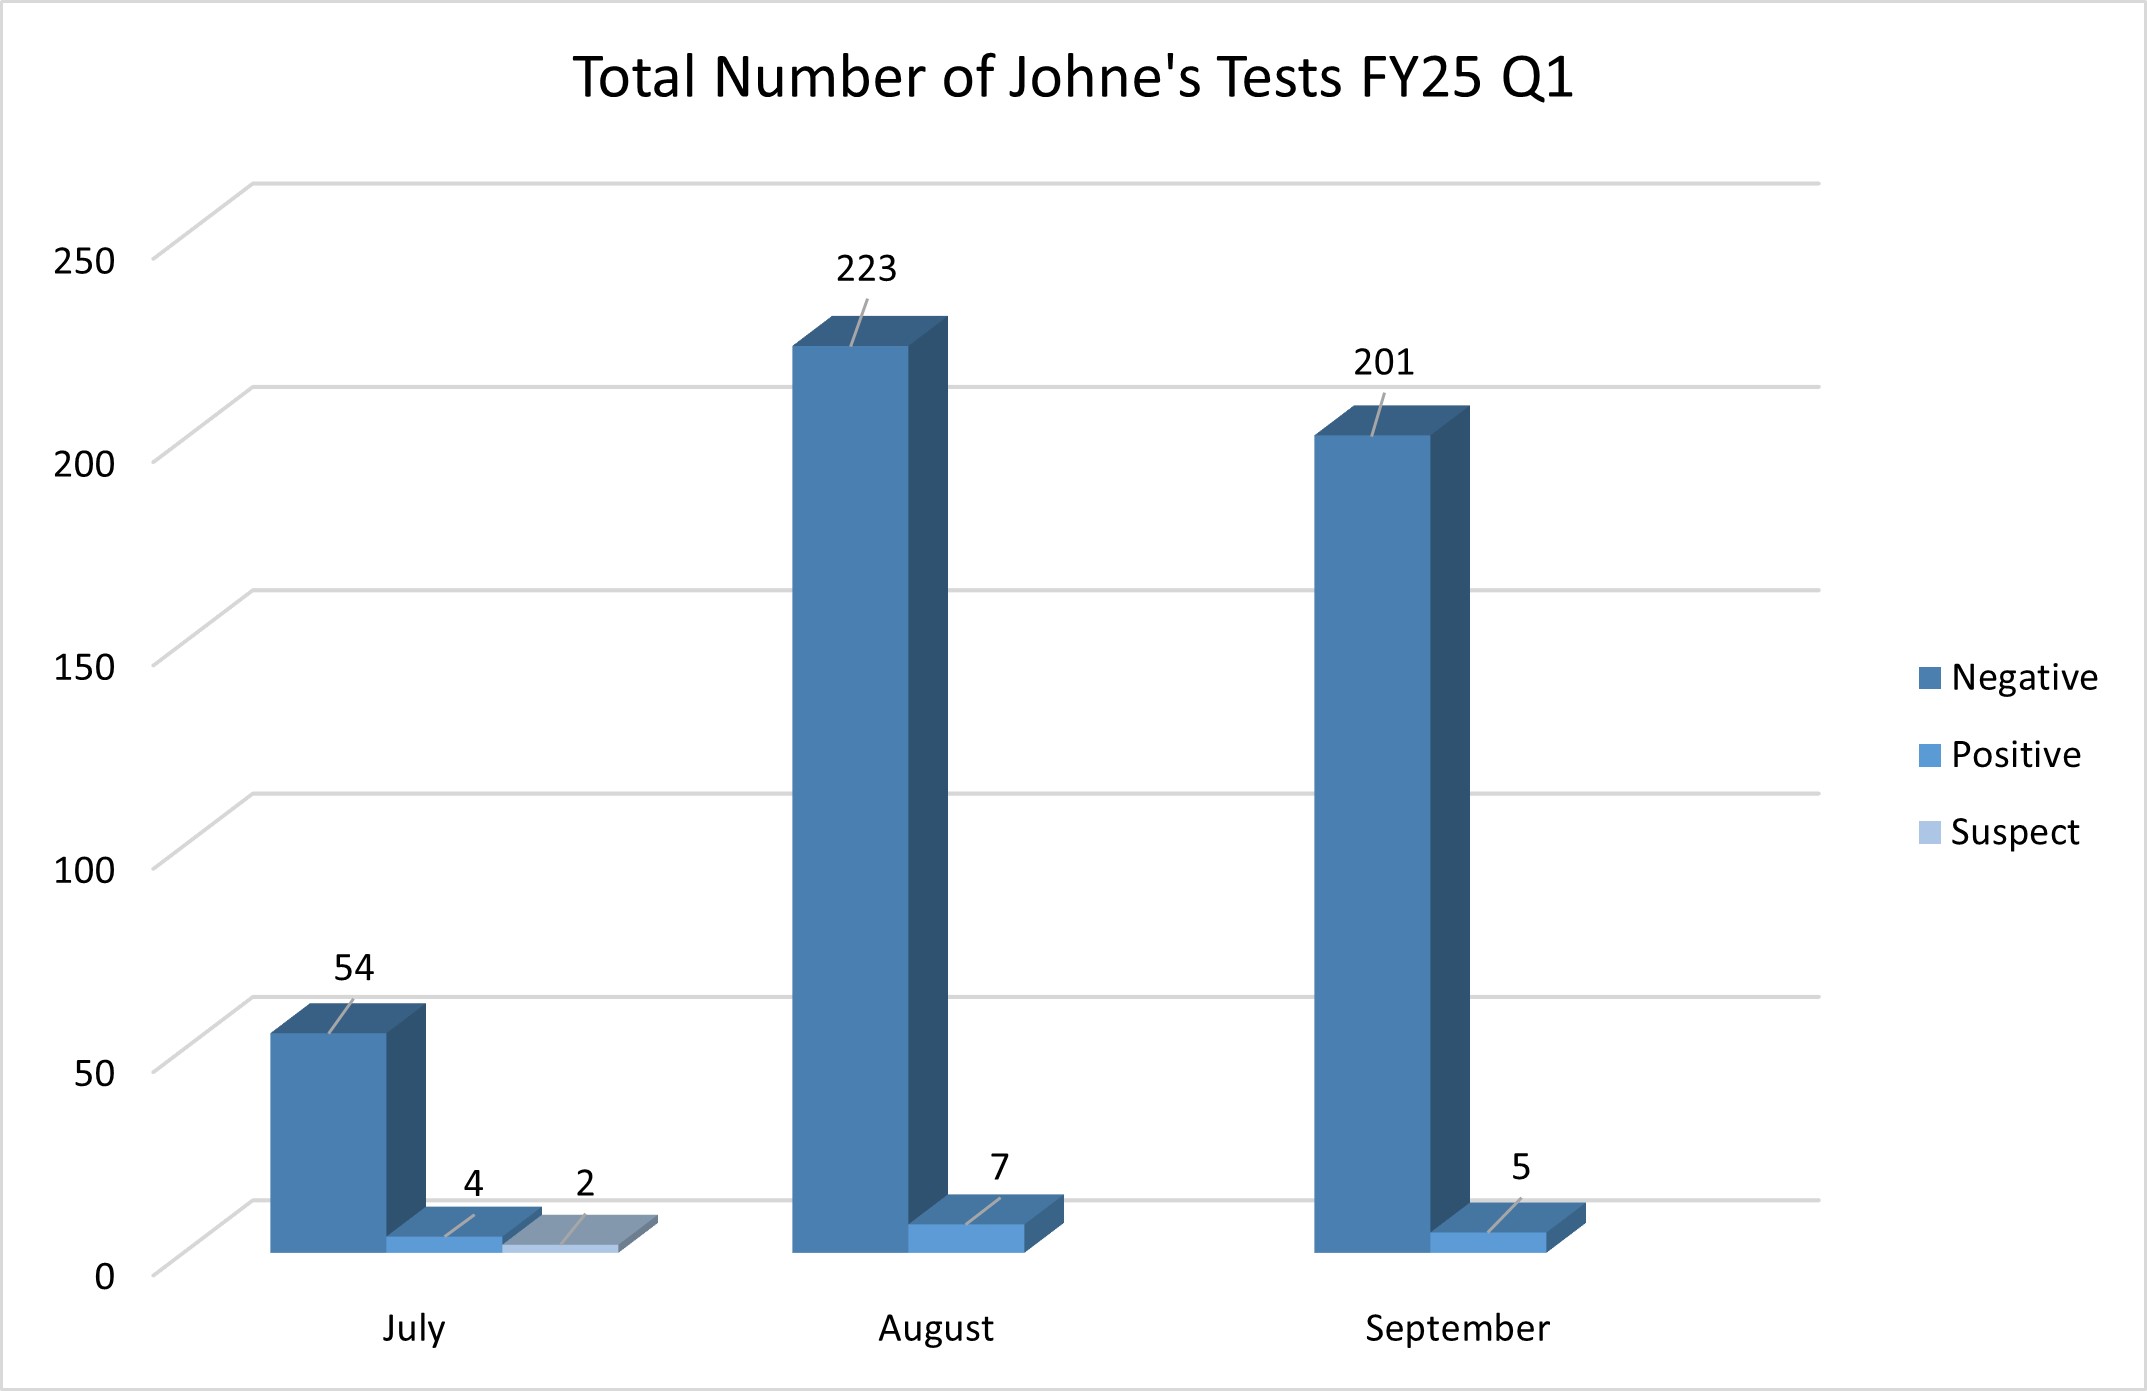
The graph above displays a bar chart summarizing the total number of Johne's disease tests conducted in Q1. This representation highlights the monthly fluctuations in testing volume and the distribution of test results across the quarter, which is essential for monitoring the prevalence and control of Johne's disease in the livestock population. This graph only shows tests completed at the Montana Veterinary Diagnostic Laboratory and not outside labs.
Montana Johne’s Testing by County FY25 Q1
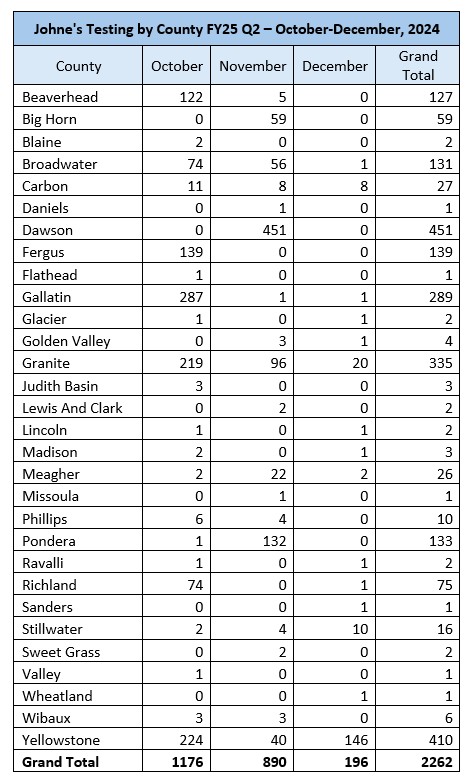
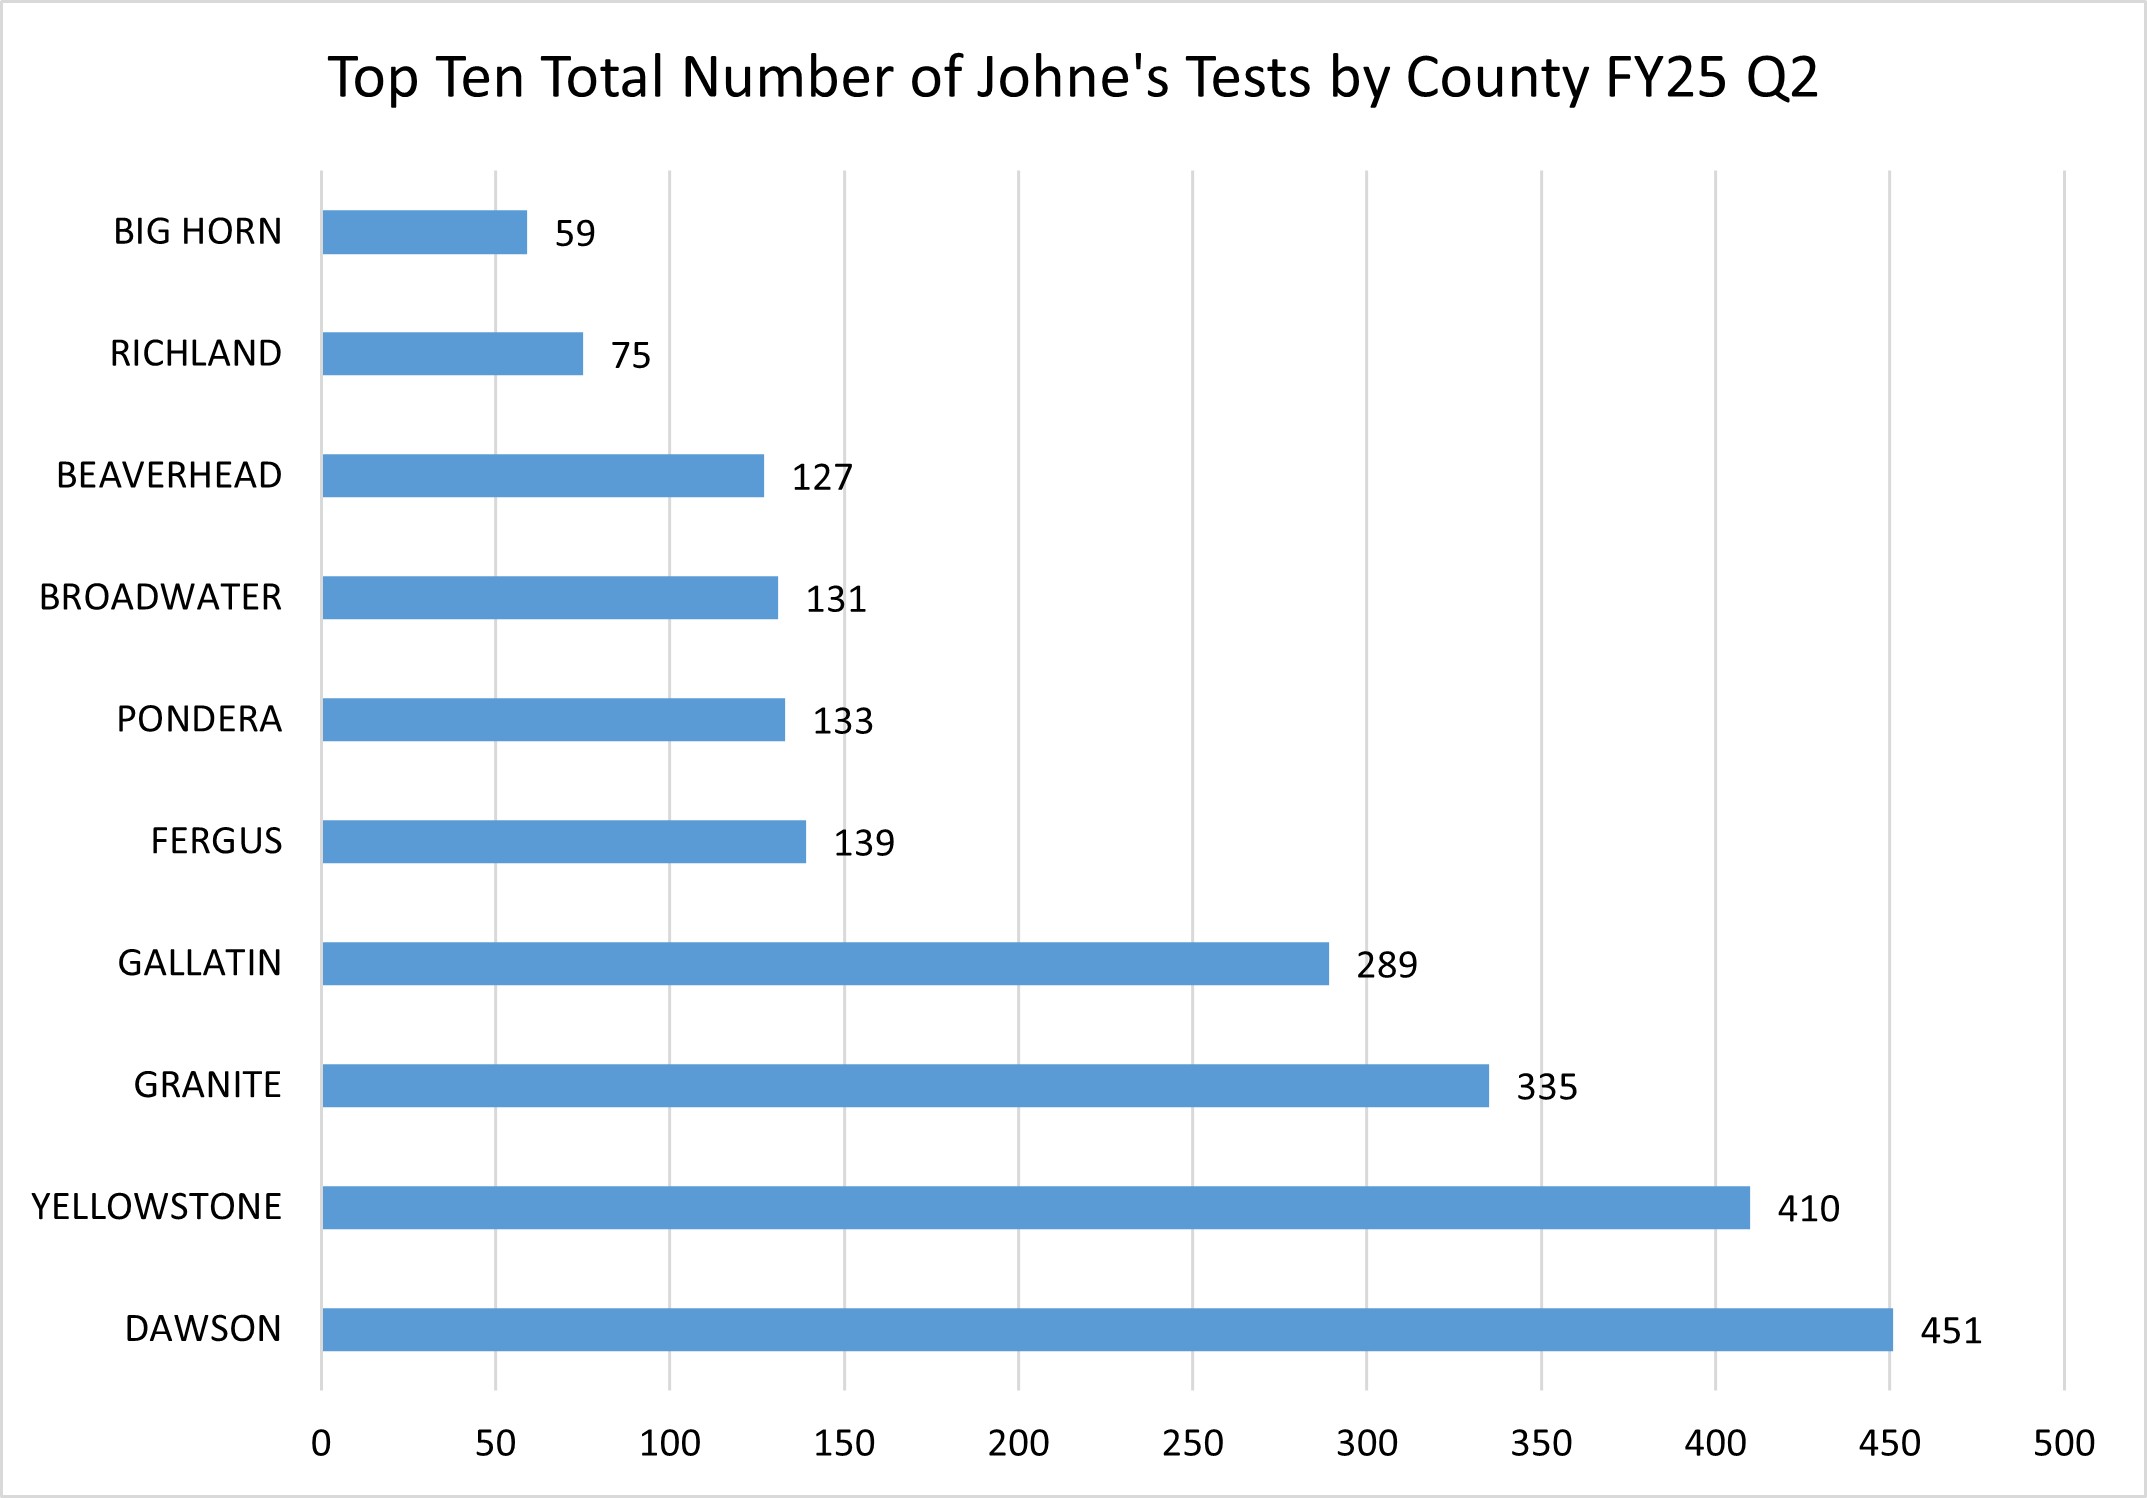
The graph above is a horizontal bar chart showing the total number of Johne's disease tests for the top counties conducted in Q2.
Historical Montana Johne’s Testing Data FY18-FY24
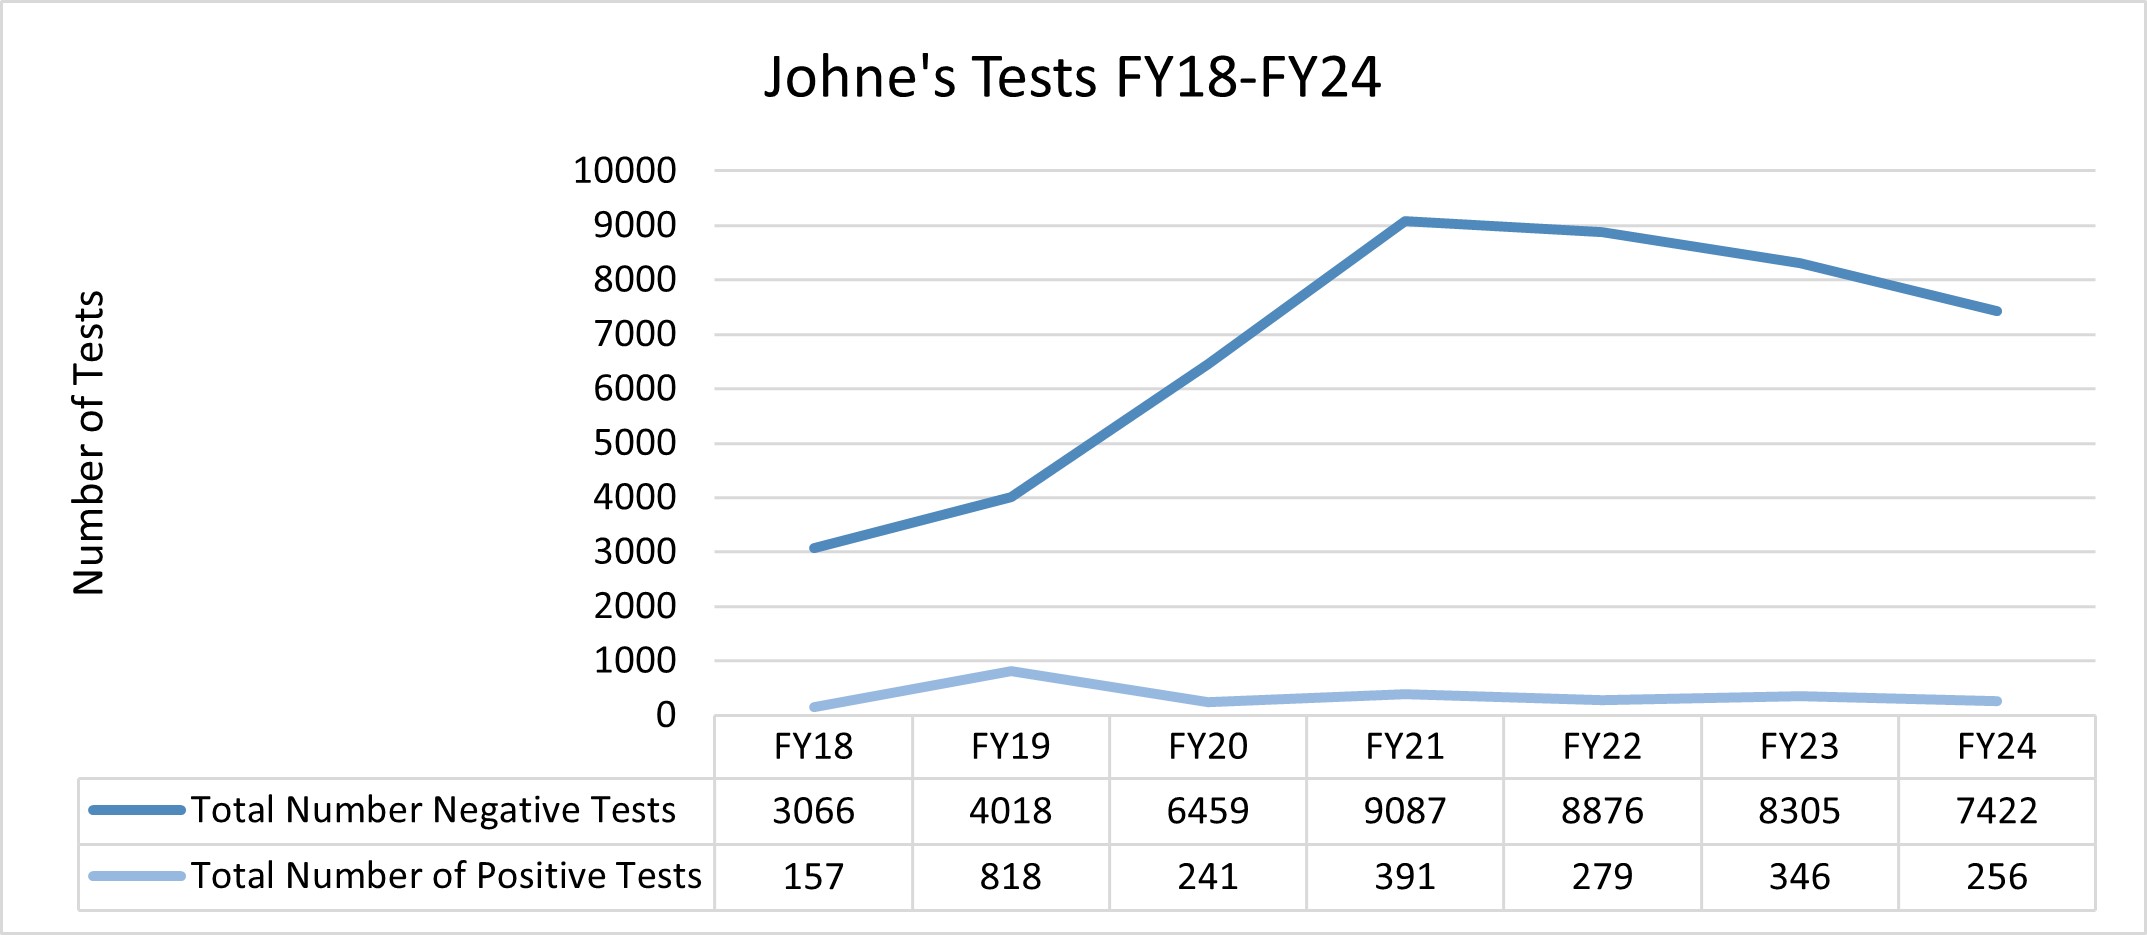
The chart above presents the annual number of Johne's disease tests conducted from FY18 to FY24. The overall number of tests has increased significantly over these years, suggesting enhanced testing efforts, and rising awareness of the disease.
Rabies
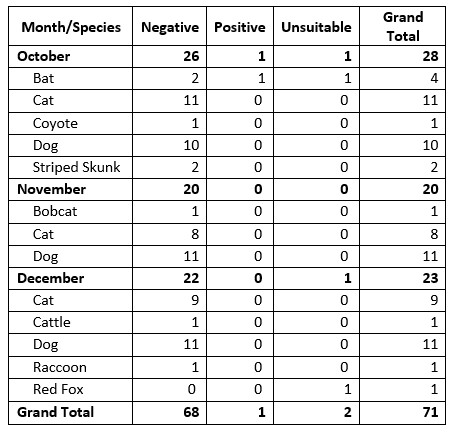
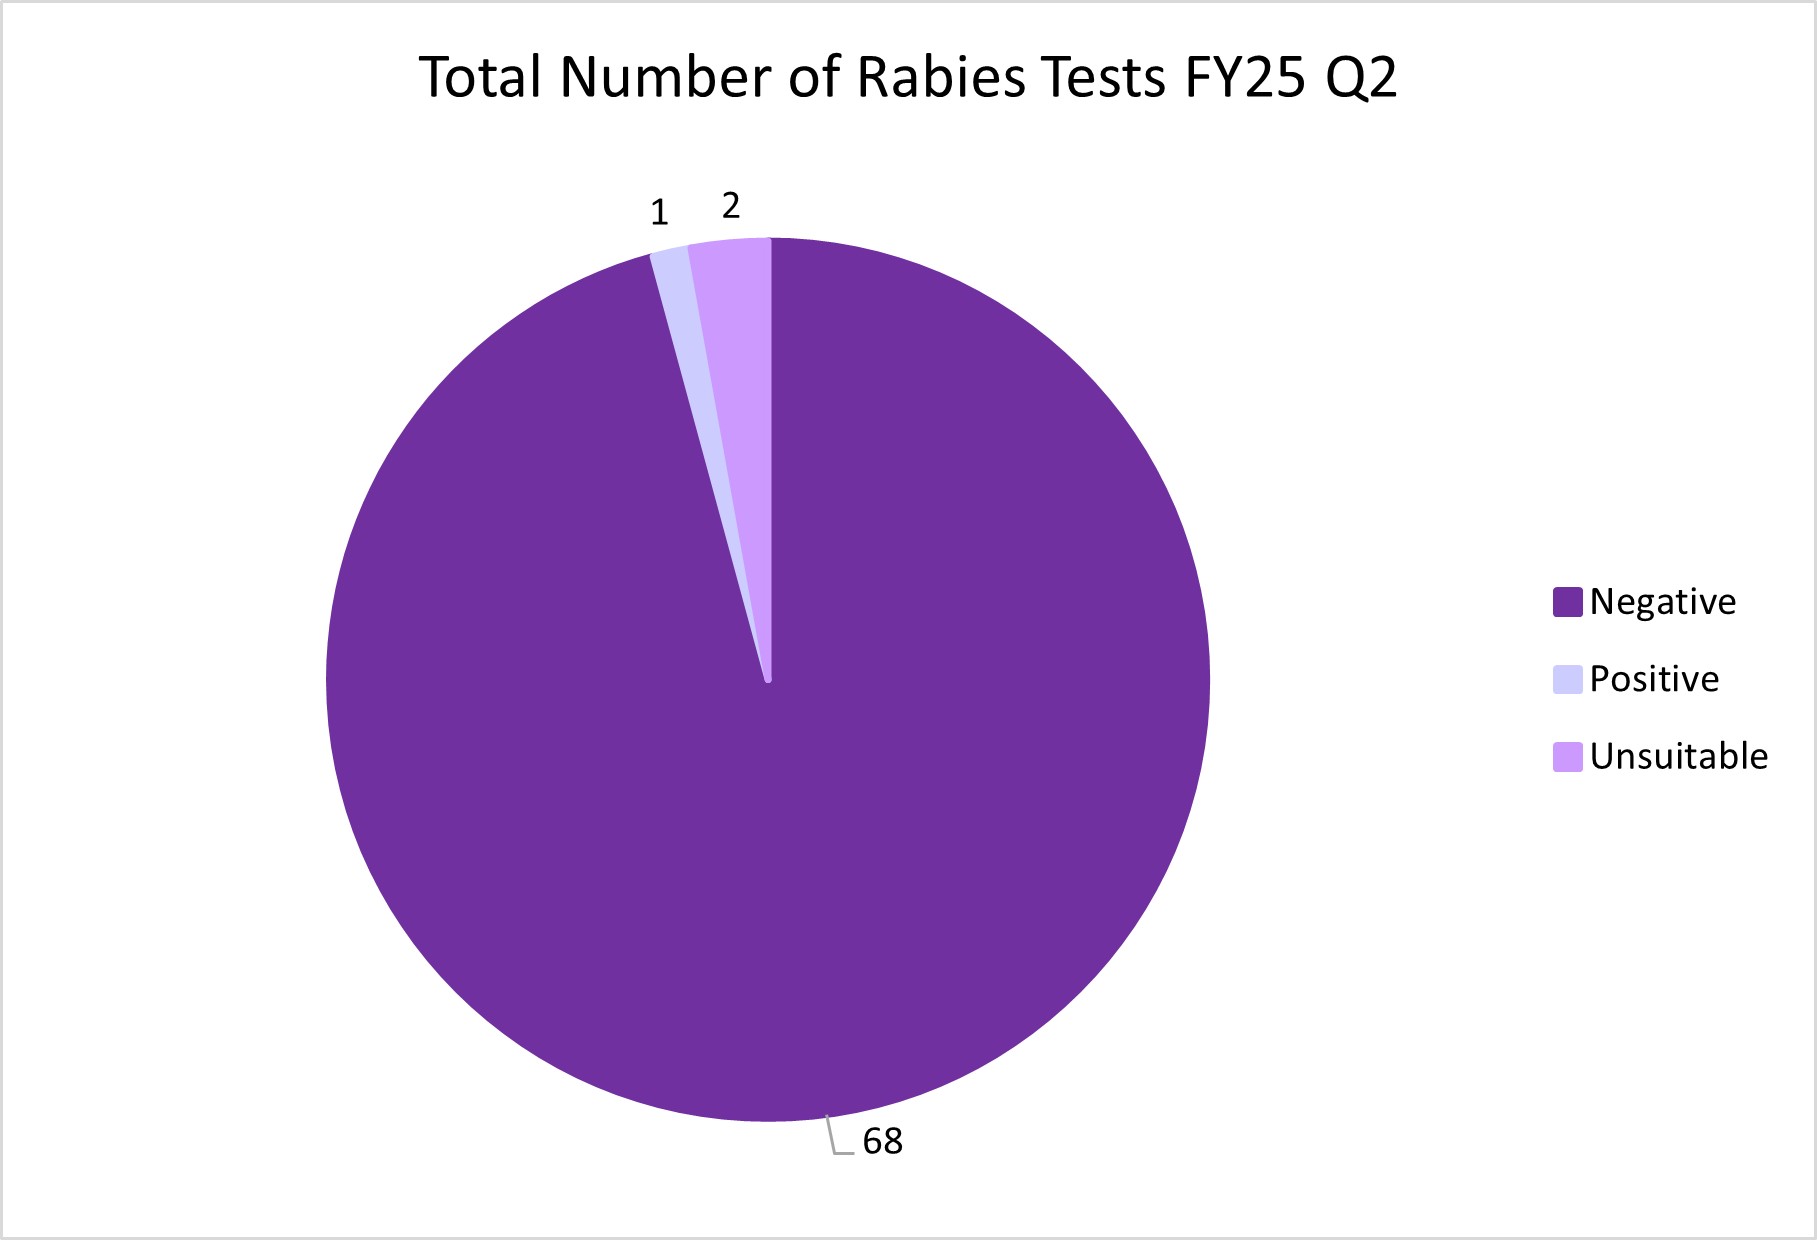
Montana Rabies Testing FY25 Q2
The table below presents a detailed Rabies Test Summary for various animal species during Q2.
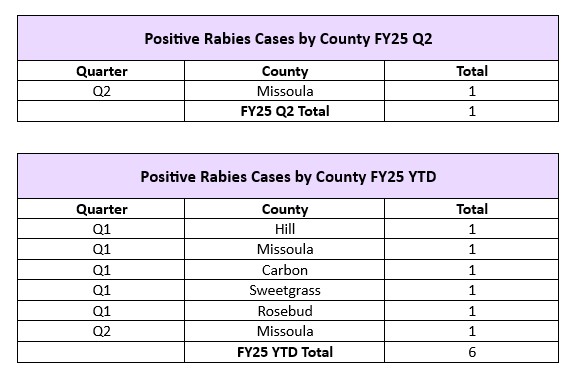
Positive Rabies Cases in Montana FY25
In the second quarter of FY25, there was one positive rabies case in Missoula County. See the tables below for a breakdown of the positive rabies case in Q2 as well as rabies cases FY25 YTD.
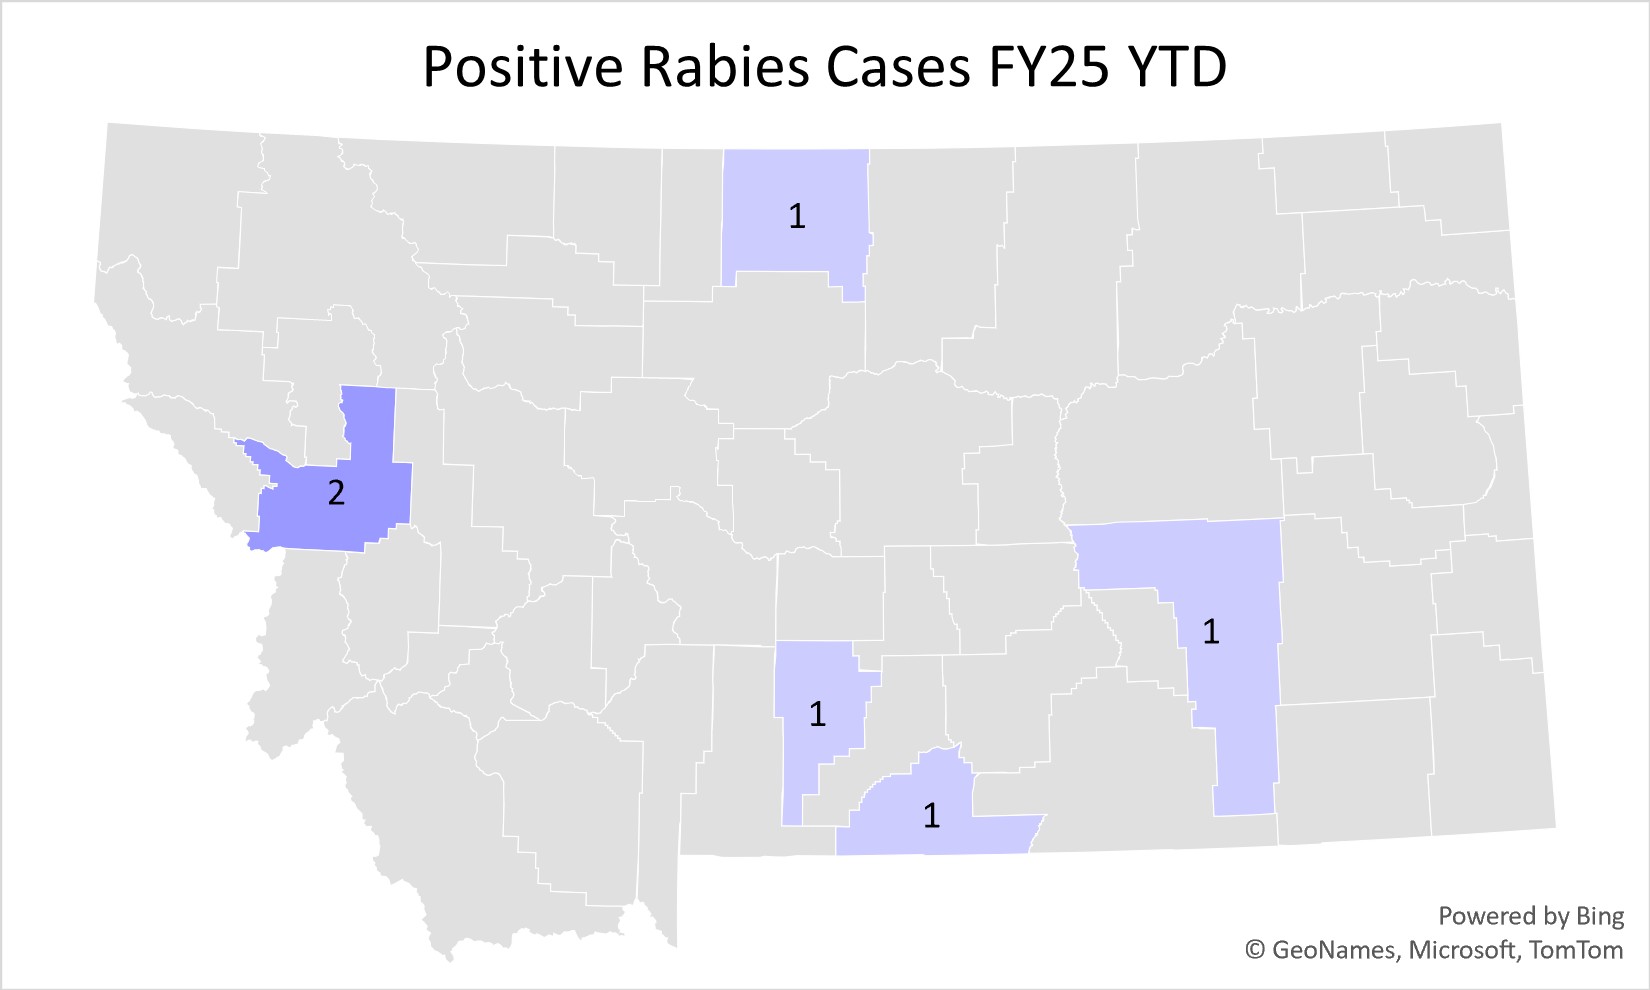
The map above shows the distribution of positive rabies cases across various counties in FY25 YTD. It illustrates the geographic spread of the disease with varying numbers indicated in each affected county. The visualization highlights areas with higher instances of rabies, suggesting regions where public health and veterinary services may need to focus their efforts on control and prevention measures.
For more information on historical rabies test data, please find an interactive Rabies positives by county map here.
Trichomoniasis
Montana Trichomoniasis Testing FY25 Q2
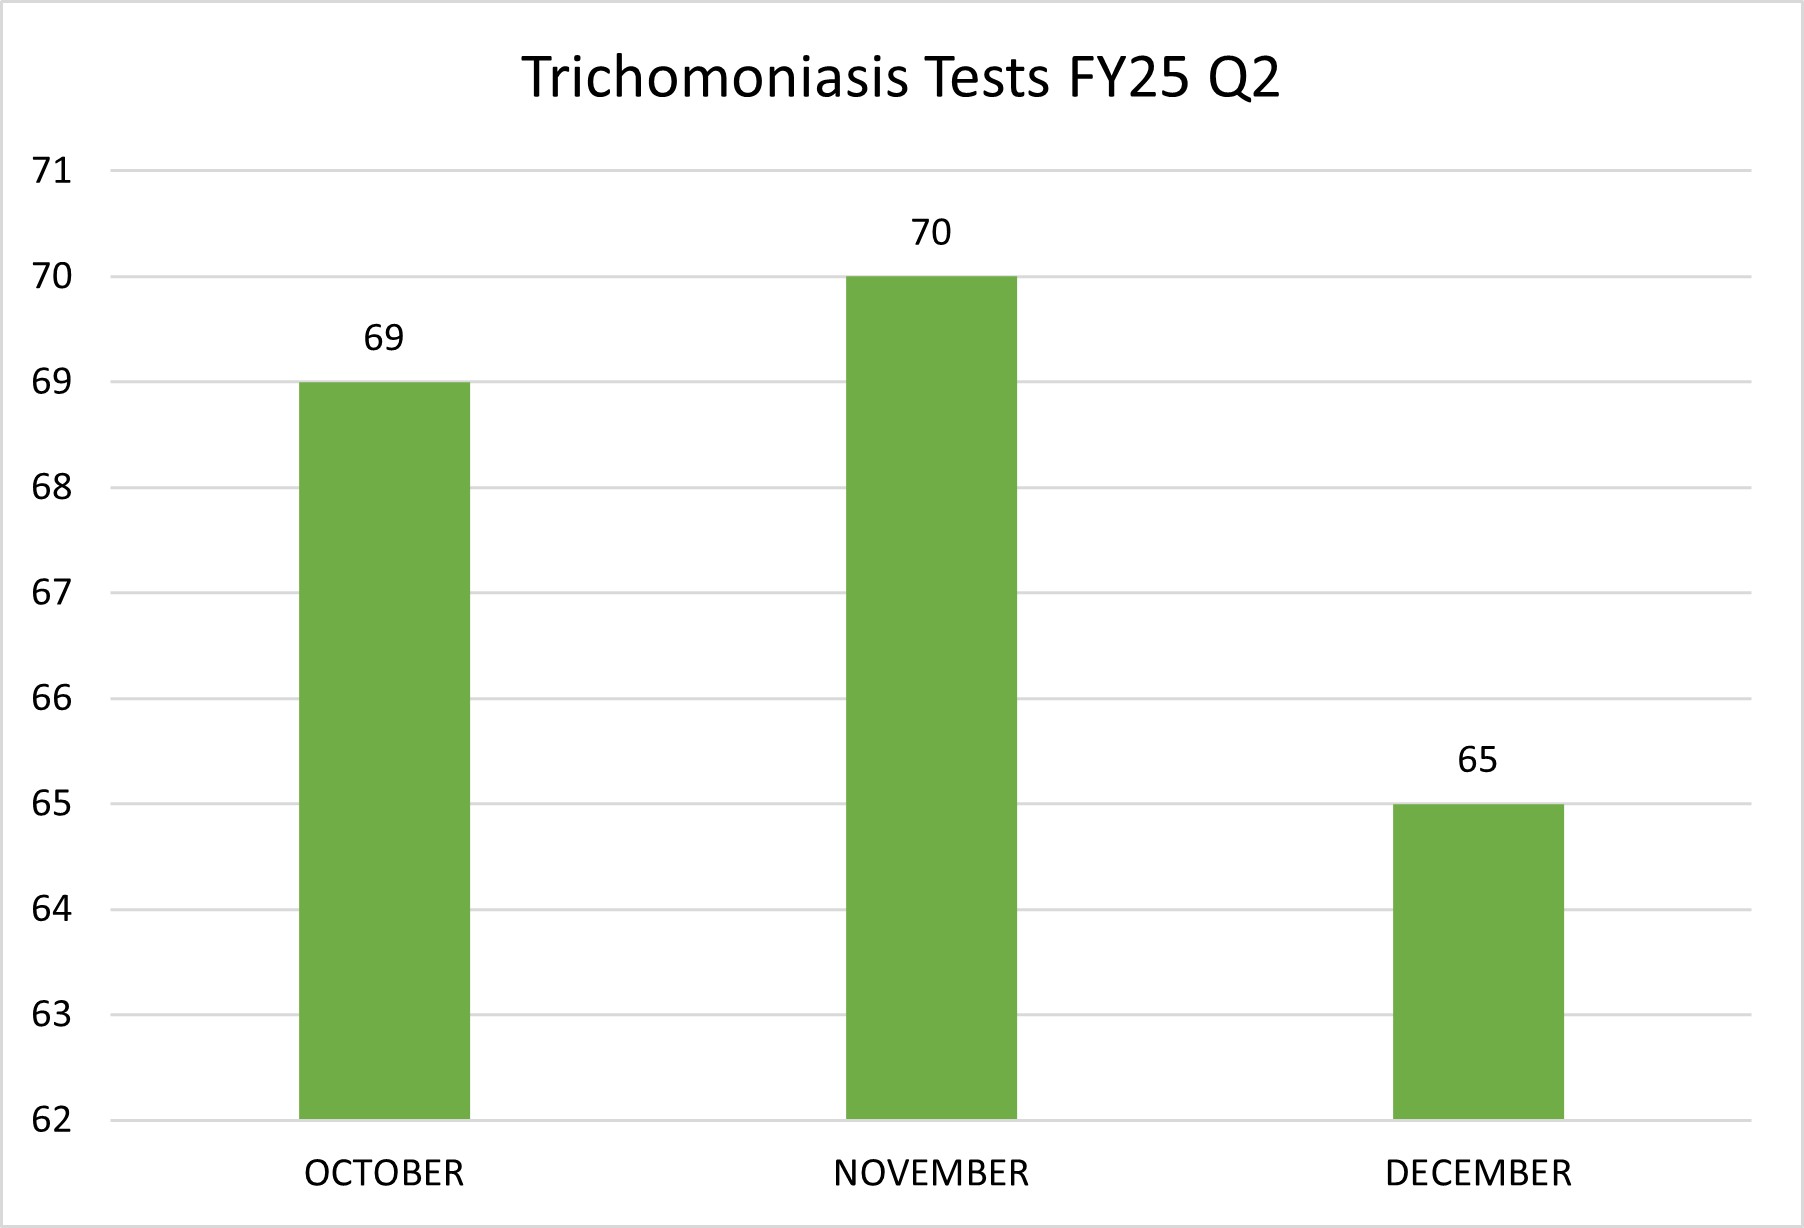
The graph above is a bar chart depicting the number of trichomoniasis tests conducted in Q2.
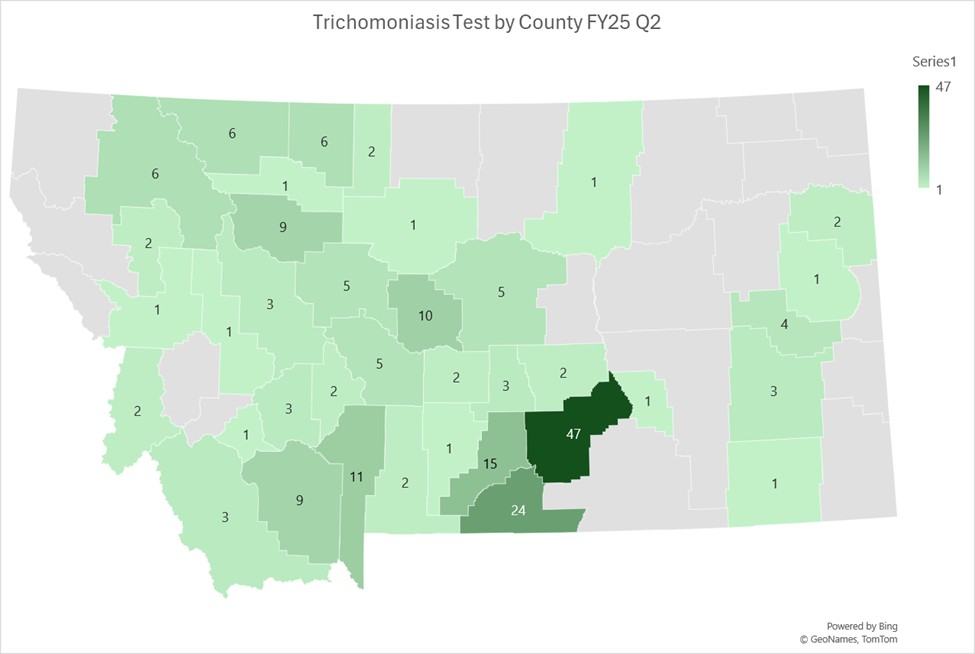
Montana Trichomoniasis Testing by County FY25 Q2
Historical Montana Trichomoniasis Testing FY16-FY24
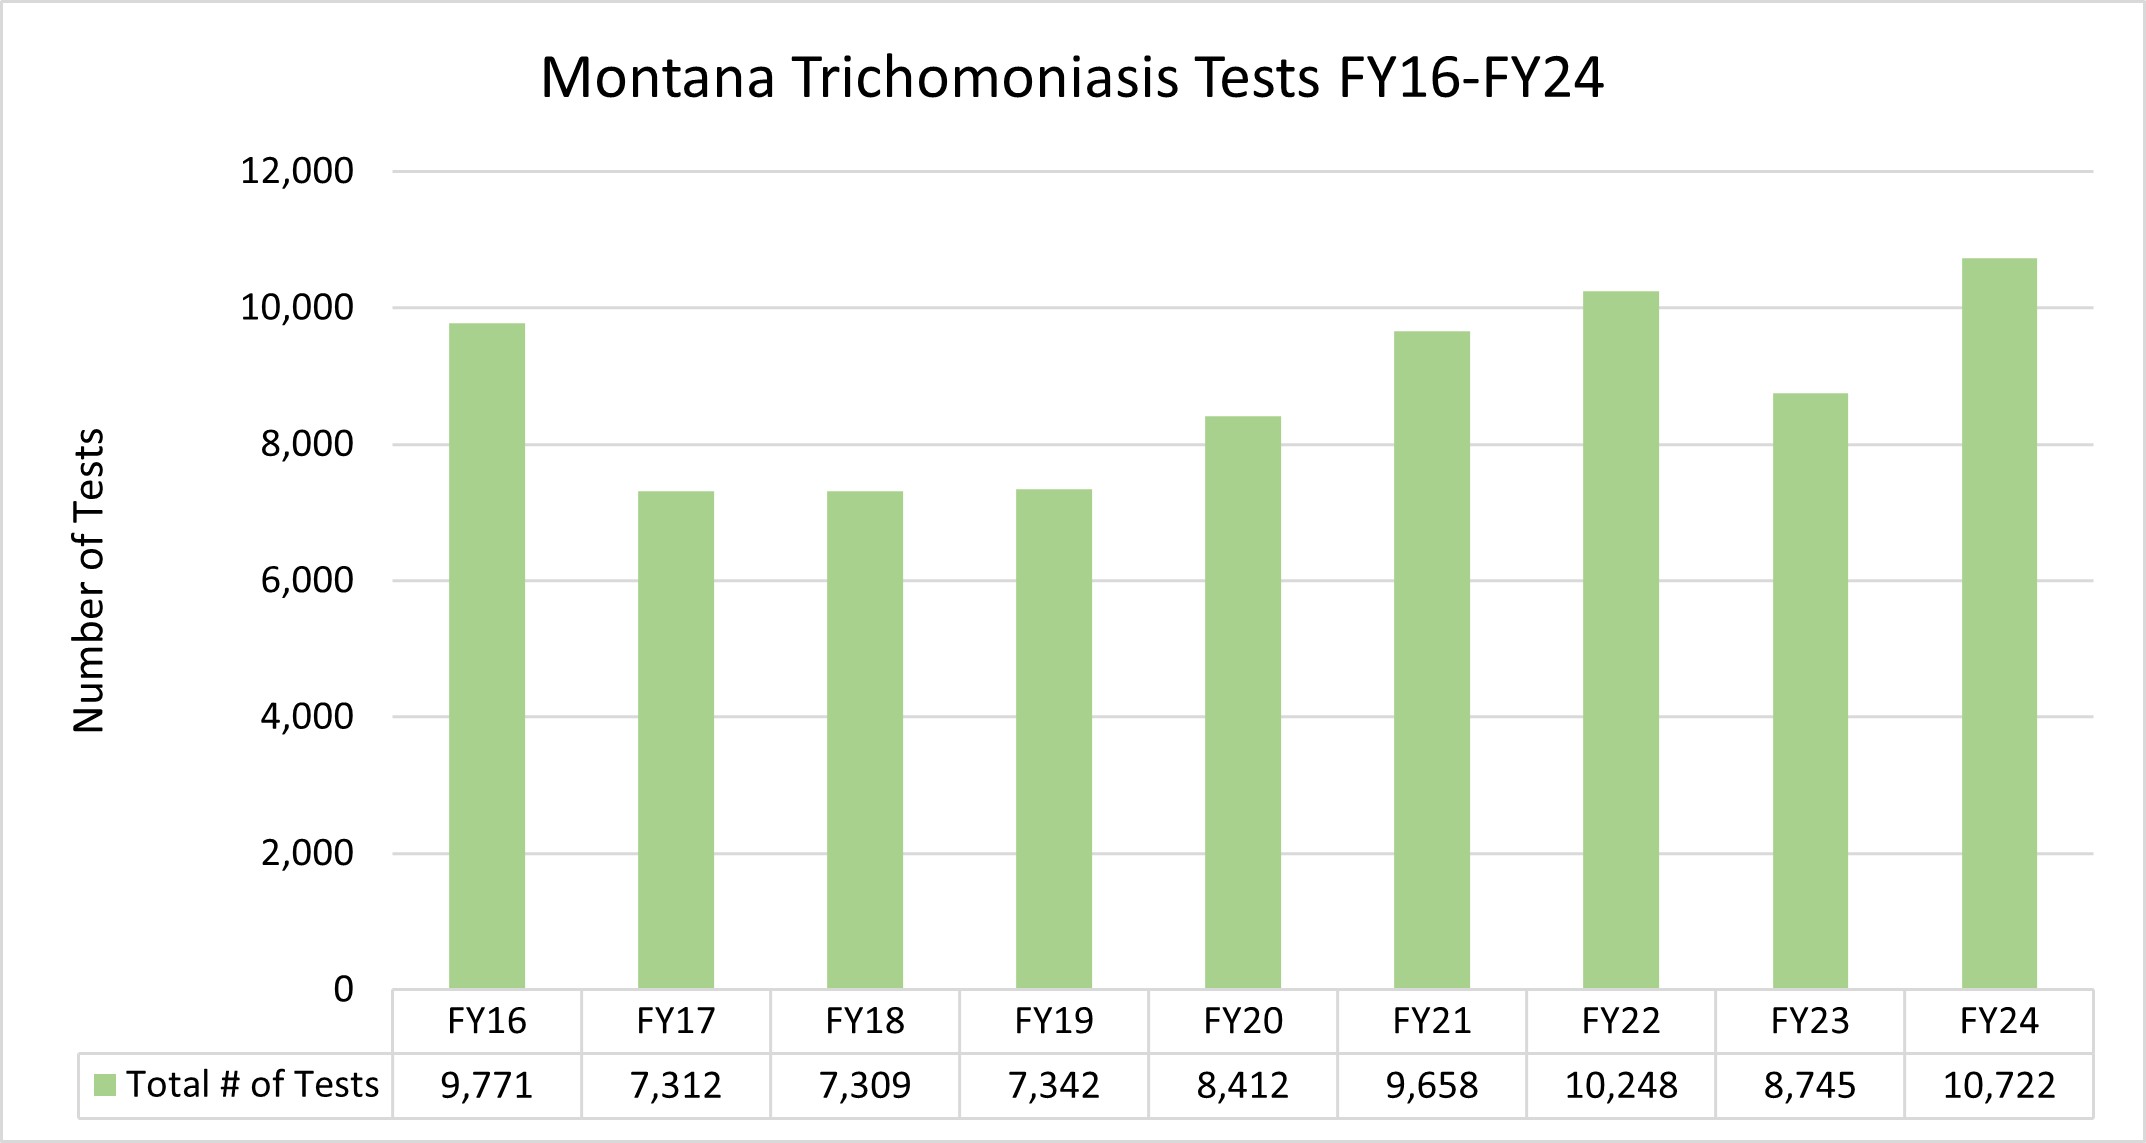
The graph above provides an annual overview of the number of Trichomoniasis tests conducted in Montana from FY16 to FY24. The data shows a general upward trend in testing over the years, which suggests increasing surveillance of the disease.
Montana Foreign Animal Disease (FAD) Investigations FY25
The following table outlines the Foreign Animal Disease (FAD) investigations carried out in Q2 in various counties. All cases in Q2 were negative.
Montana Reportable Diseases FY24
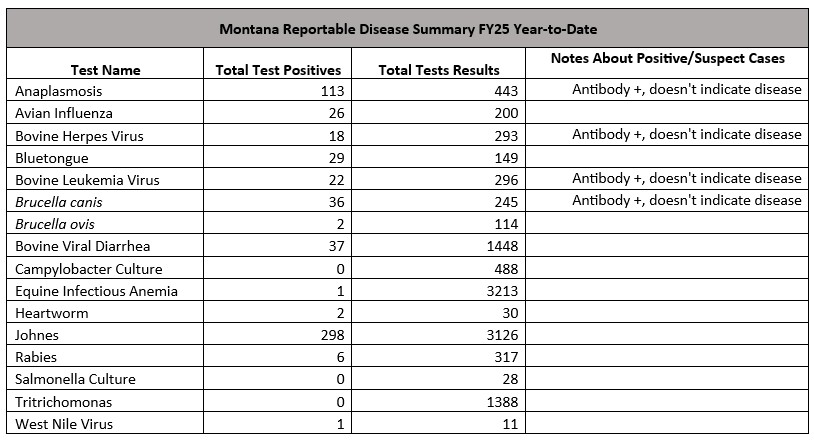
The table below shows testing for other reportable diseases in Montana for FY 2025 Quarter 2. Please note, positive test results may not be confirmation of disease depending on the type of test conducted. 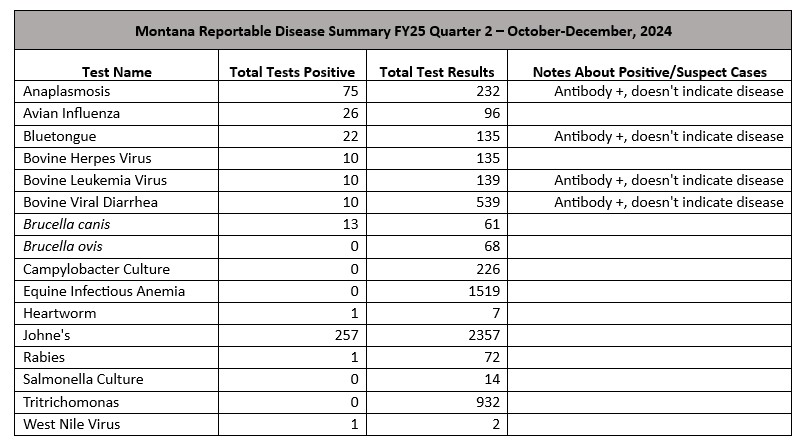
The table below shows testing for other reportable diseases in Montana for FY 2025 Year-to-Date. Please note, positive test results may not be confirmation of disease depending on the type of test conducted.