Here to serve the people of Montana and its livestock industry.
Animal Health Bureau
- Permits & Forms
- Brucellosis
- Brucella canis
- Feral Swine
- High Path Avian Influenza
- Johne's
- Rabies
- Trichomoniasis
- West Nile Virus
- National Poultry Improvement Program (NPIP)
- Pay for Permits Online
Helpful Links
Contact Information
Department of Livestock
Animal Health Bureau
PO Box 202001
Helena, MT 59620-2001
Email: livemail@mt.gov
FY24 Q1 Disease Reporting
Click the highlighted link below to go directly to that section.
- Brucellosis
- Brucella canis
- Johne's
- Rabies
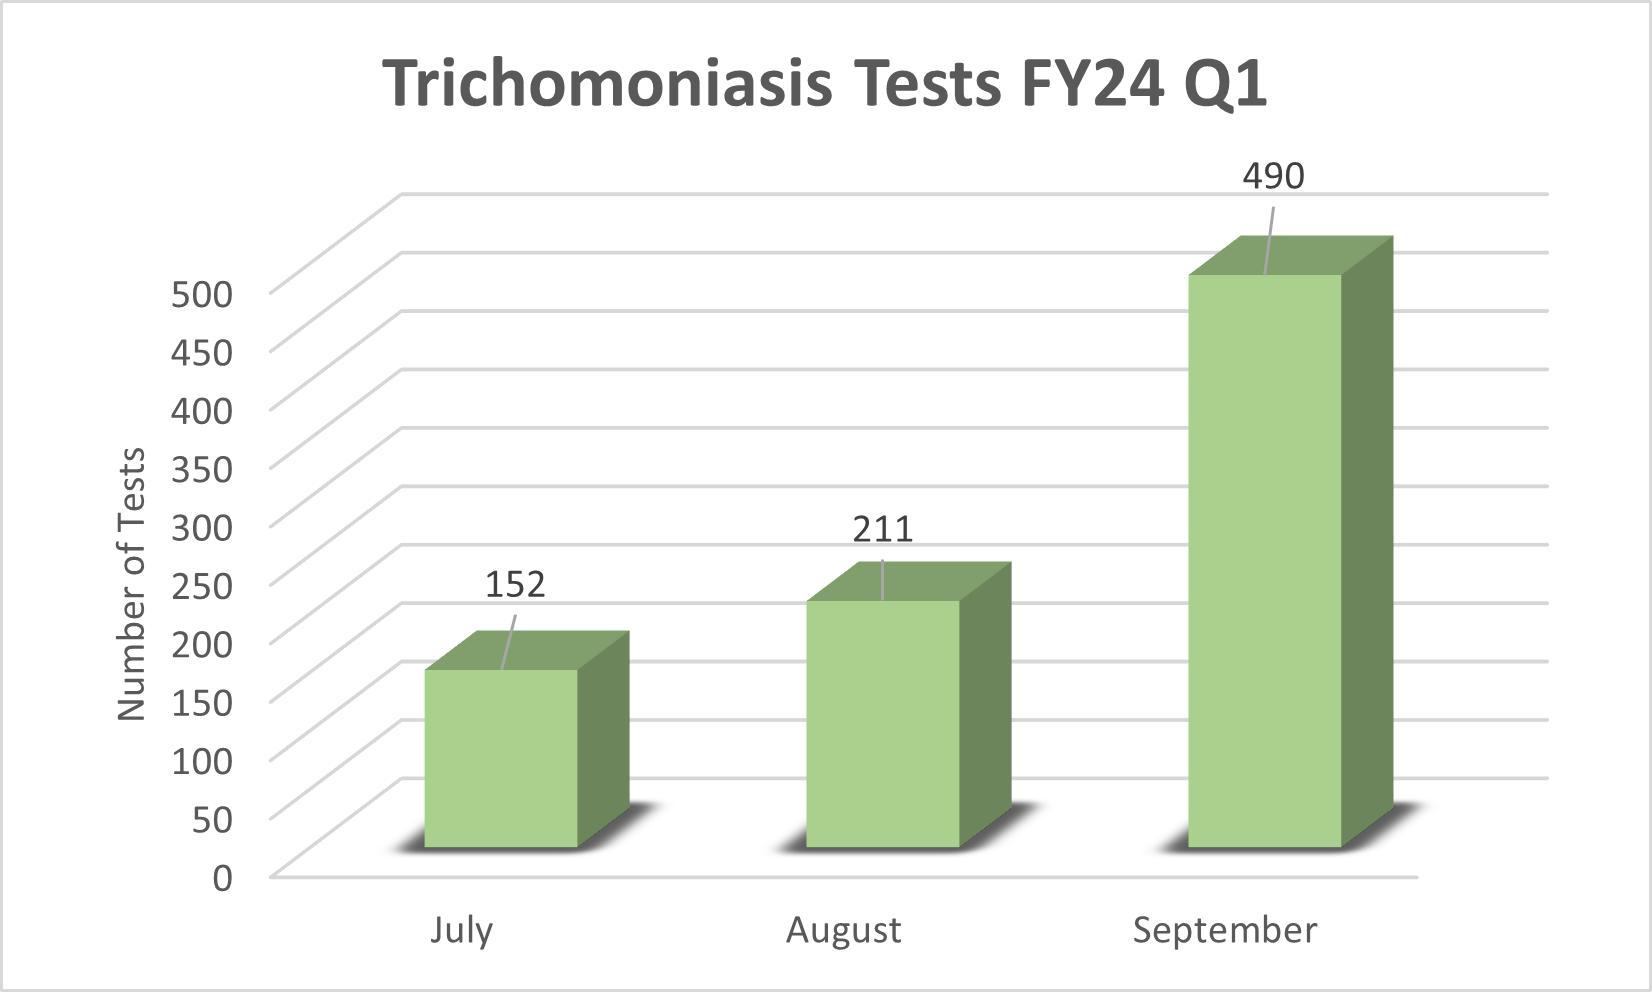
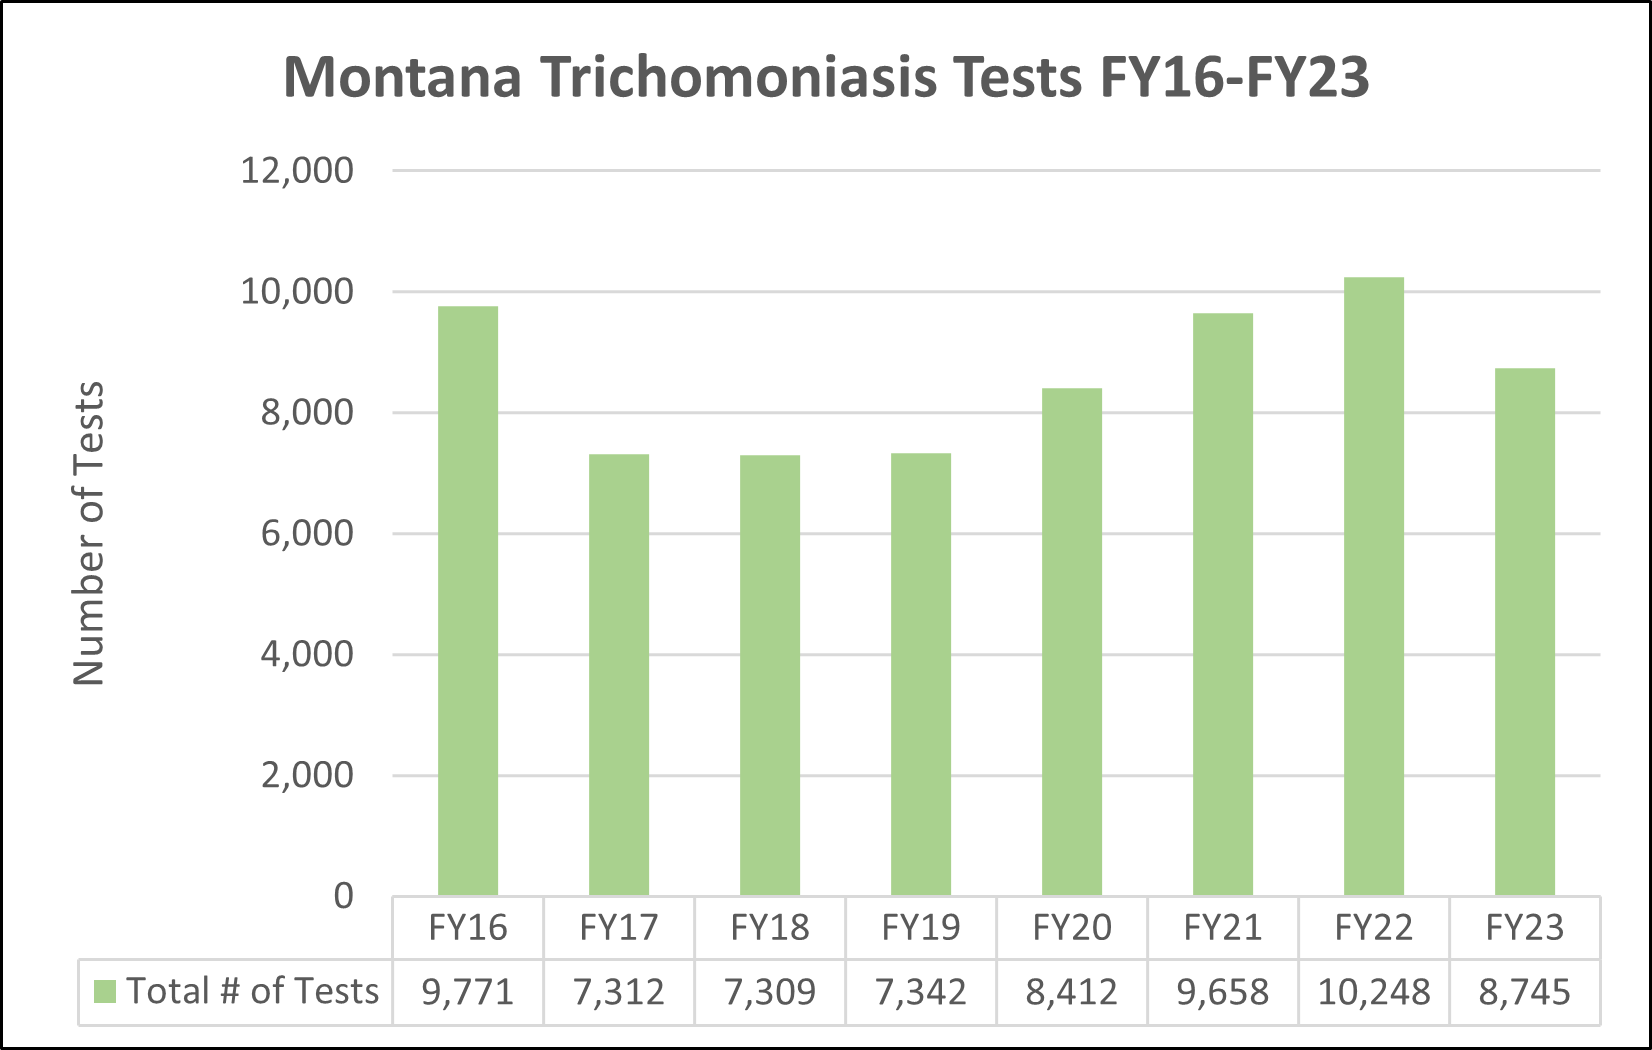
- Trichomoniasis
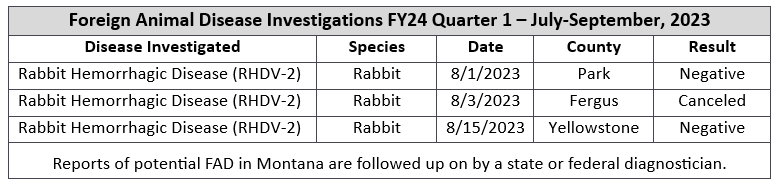
- Montana Foreign Animal Disease (FAD) Investigations FY24
- Montana Reportable Diseases FY24
Montana Brucellosis FY23 and FY24 YTD Comparison Tests
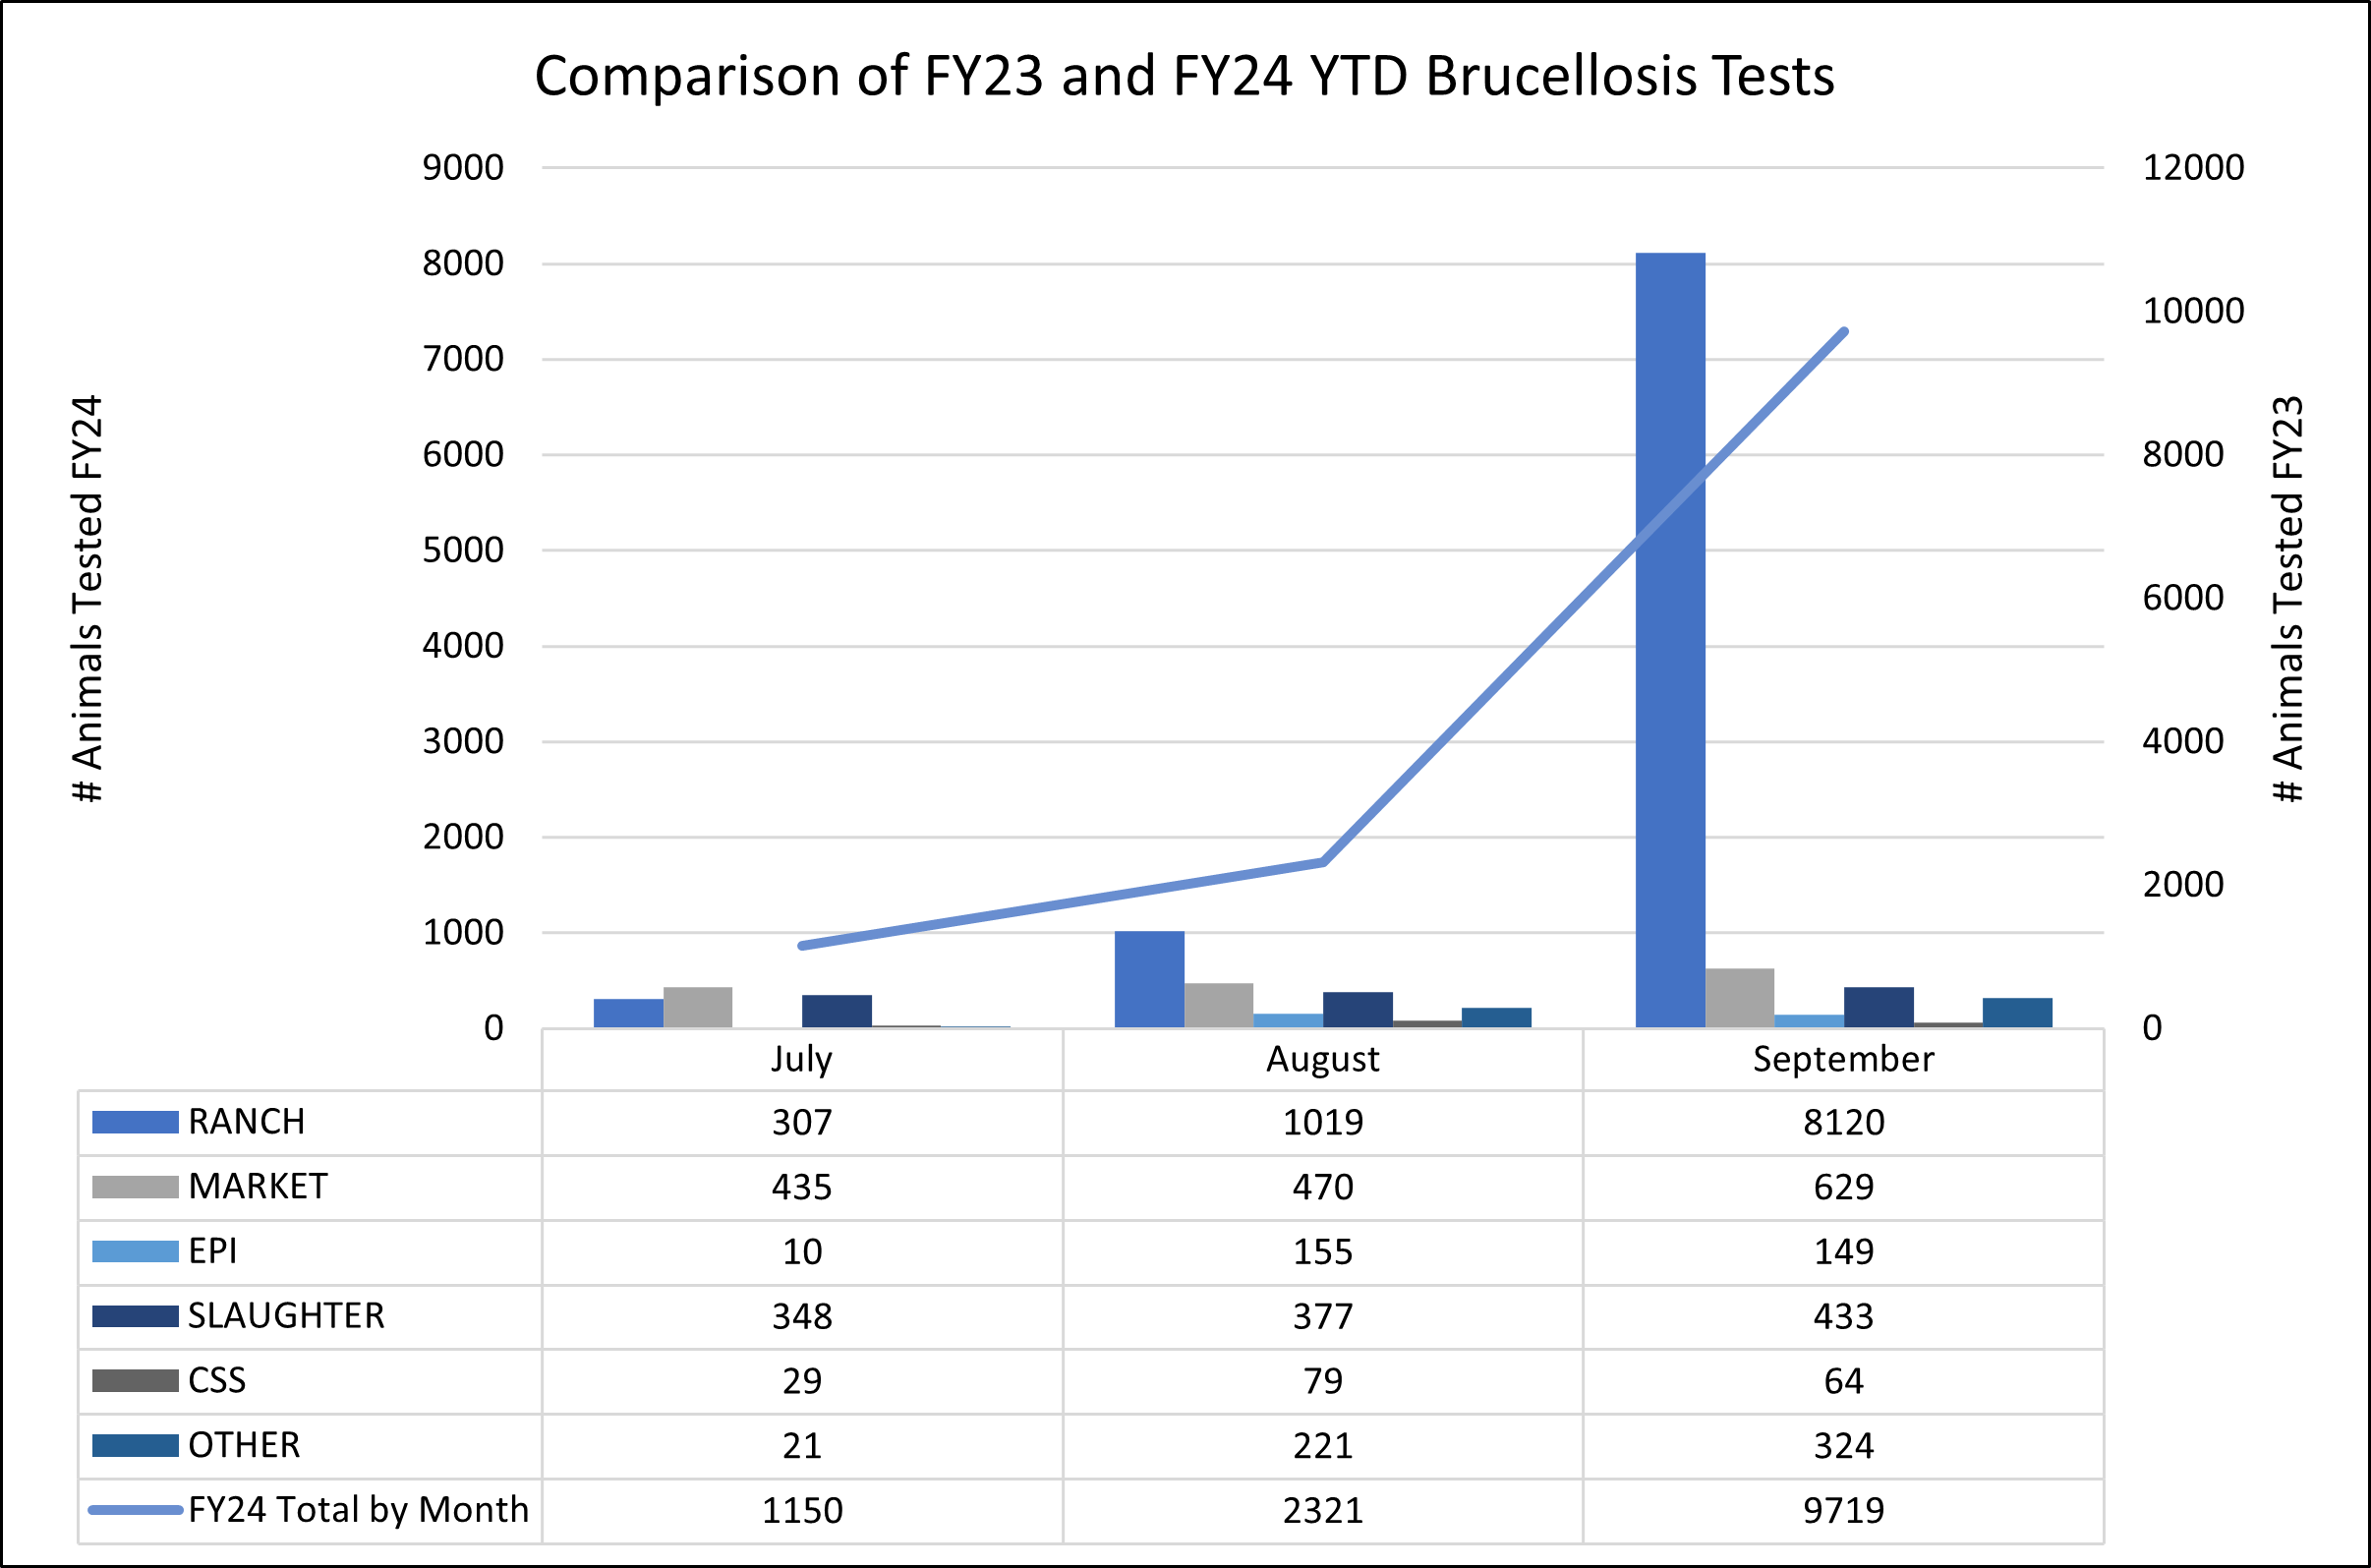
The graph above shows a comparison of the number of animals tested for Brucellosis in FY23 and FY24 through the current quarter, with data for each month breaking down the total number of tests by category such as Ranch, Market, Epidemiological (Epi), Slaughter, Certified Semen Service (CSS), and Other. Generally, the trend in test numbers is consistent from year to year, although test numbers for September 2023 were higher. Test numbers follow the seasonality of the cattle production cycle and are useful in predicting program expenditures.
Designated Surveillance Area (DSA) Reimbursements for Testing & Vaccination
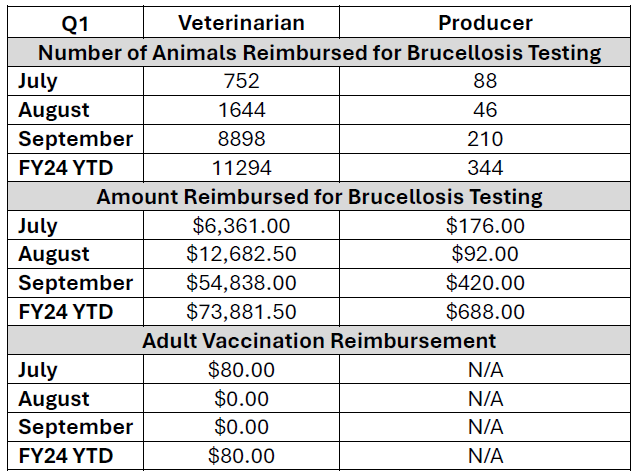
Department reimbursement for testing has helped to minimize DSA producer costs for program compliance while protecting the remainder of the State from unnecessary testing due to loss of brucellosis Class Status or trading partner confidence. The table above reflects reimbursements for Brucellosis testing across two groups: veterinarians and producers, for the first quarter of FY24. Additionally, there was a nominal adult vaccination reimbursement in July, with no further reimbursements recorded for the rest of Q1. This data highlights the financial aspect of disease management and control efforts within the livestock industry. Funding for Montana’s brucellosis program comes from Montana General Fund and cooperative agreement funding from USDA Veterinary Services (VS).

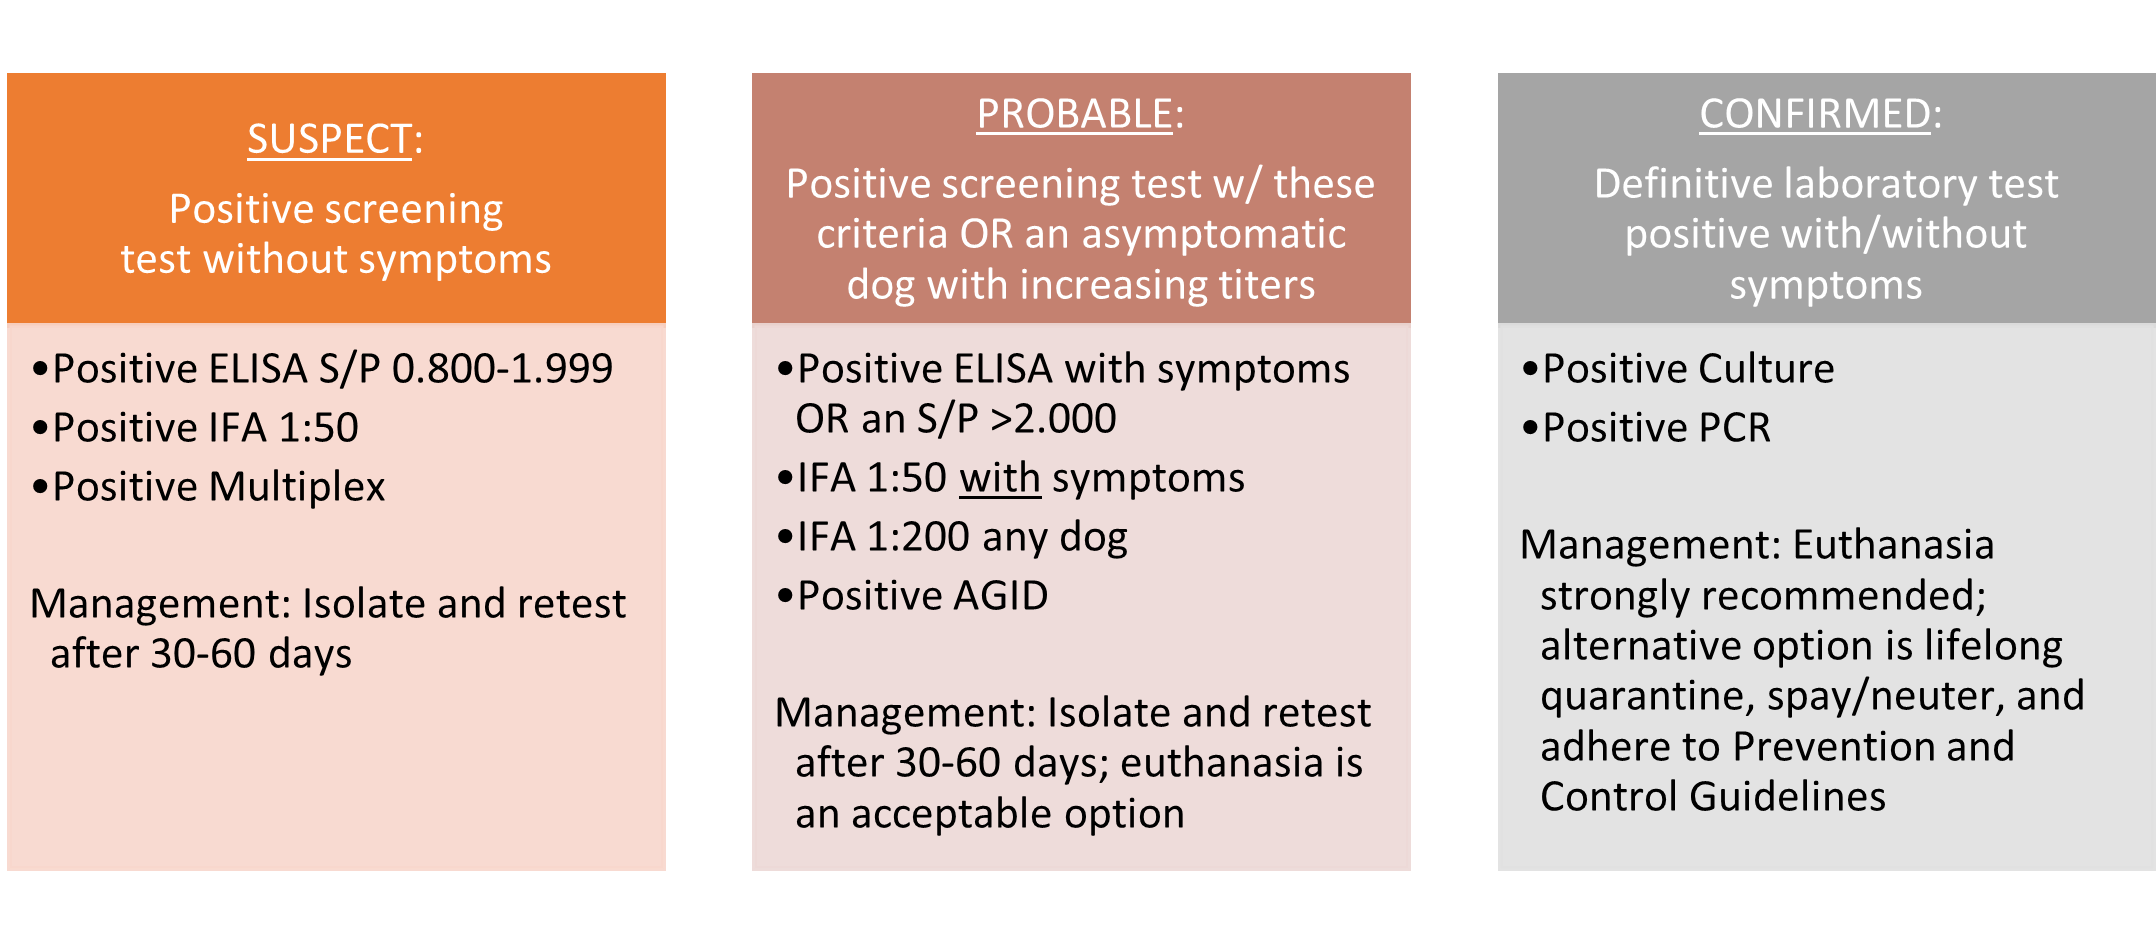
The table above shows the total number of positive screening tests results and classifies the results by case definitions that DOL currently uses, which are listed below with criteria. This table also indicates the number of cases that were confirmed B. canis infection through culture. Two dogs were confirmed positive for B. canis during Q1 – both dogs were euthanized.
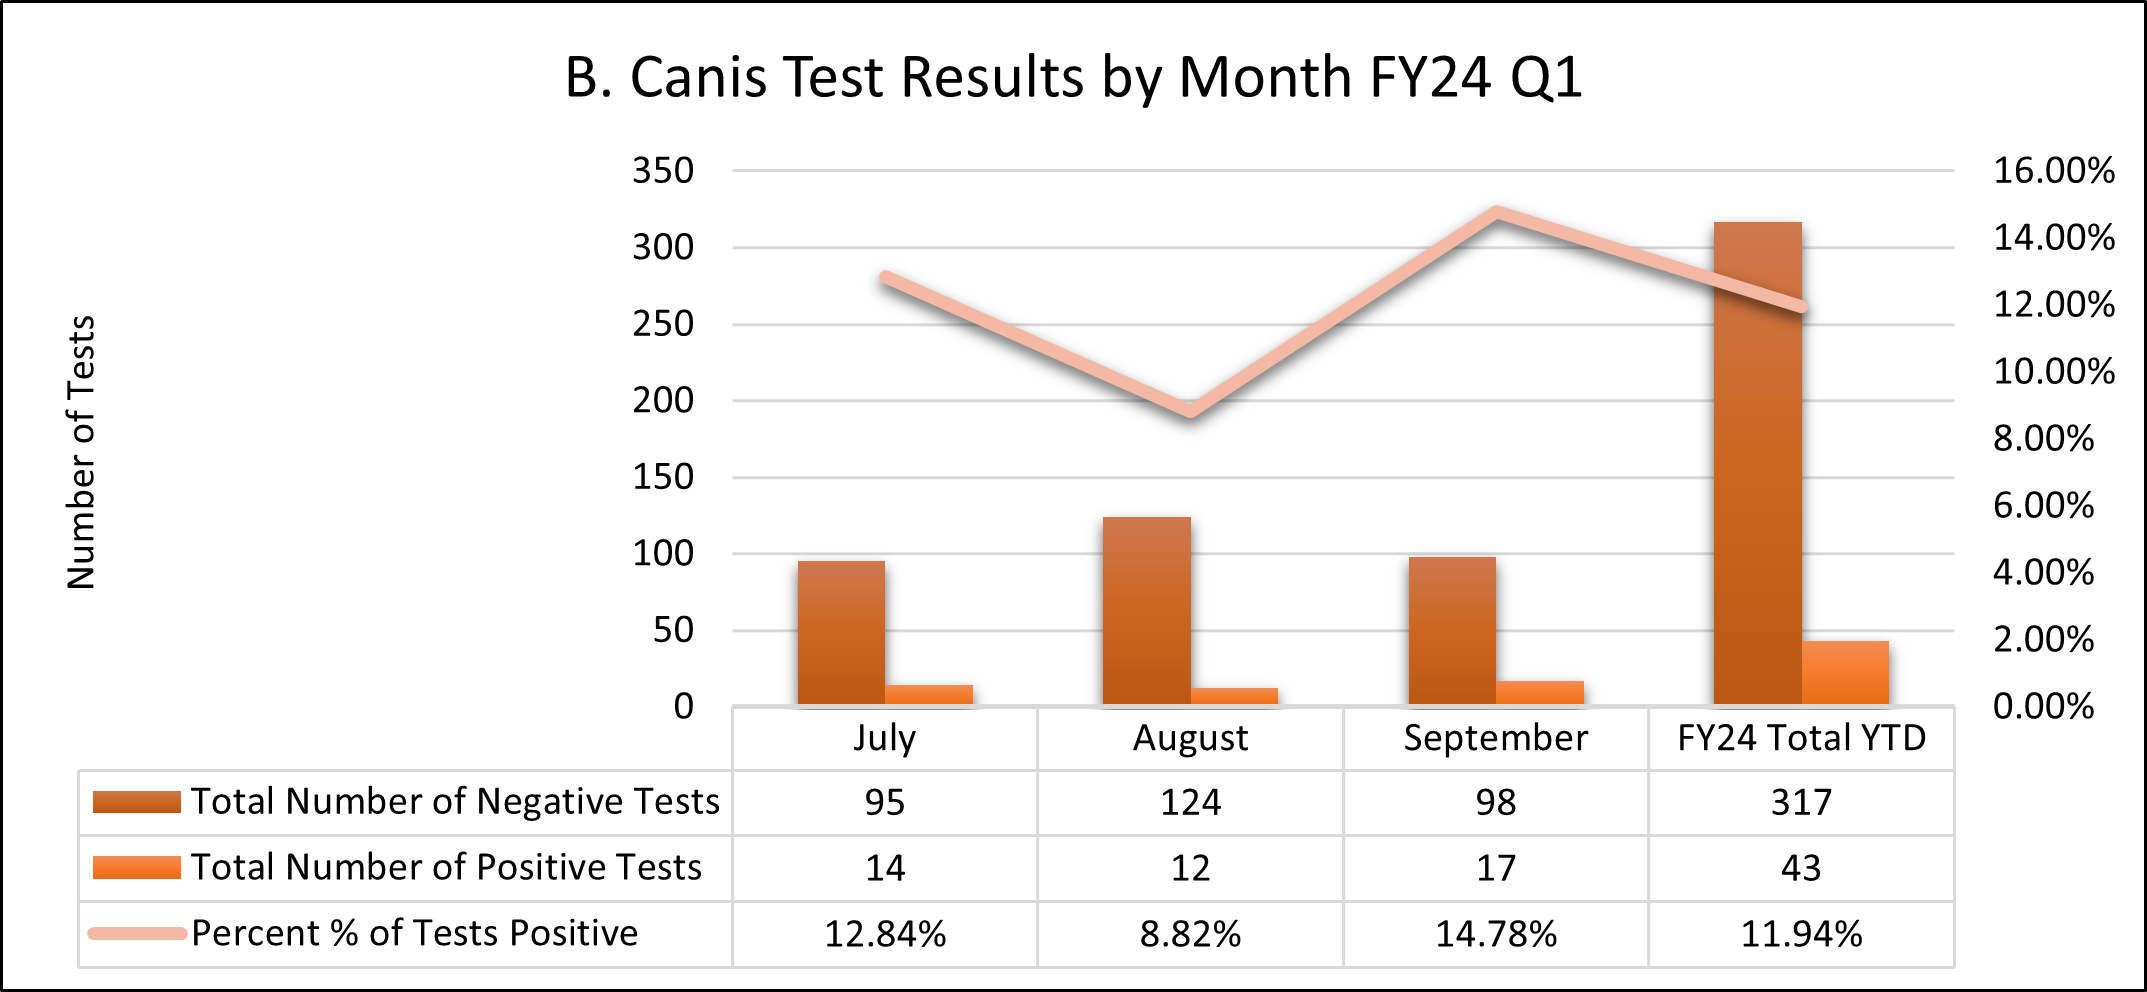
The graph above shows B. canis test results over the first quarter of FY24. The end of the quarter shows an overall percent positive rate of 11.94%, with a total of 43 positive tests out of 317 conducted, a significant incidence of B. canis that warrants attention for public health and veterinary intervention.

The graph above compares the number of B. canis tests conducted in FY23 and FY24 up to the current quarter. FY 23 testing shows a general increase in the number of tests conducted, with a notable peak in February 2024. FY24 testing for the first quarter exceeds testing for the same period last year.
Montana Brucella canis (B. canis) Testing by County FY24
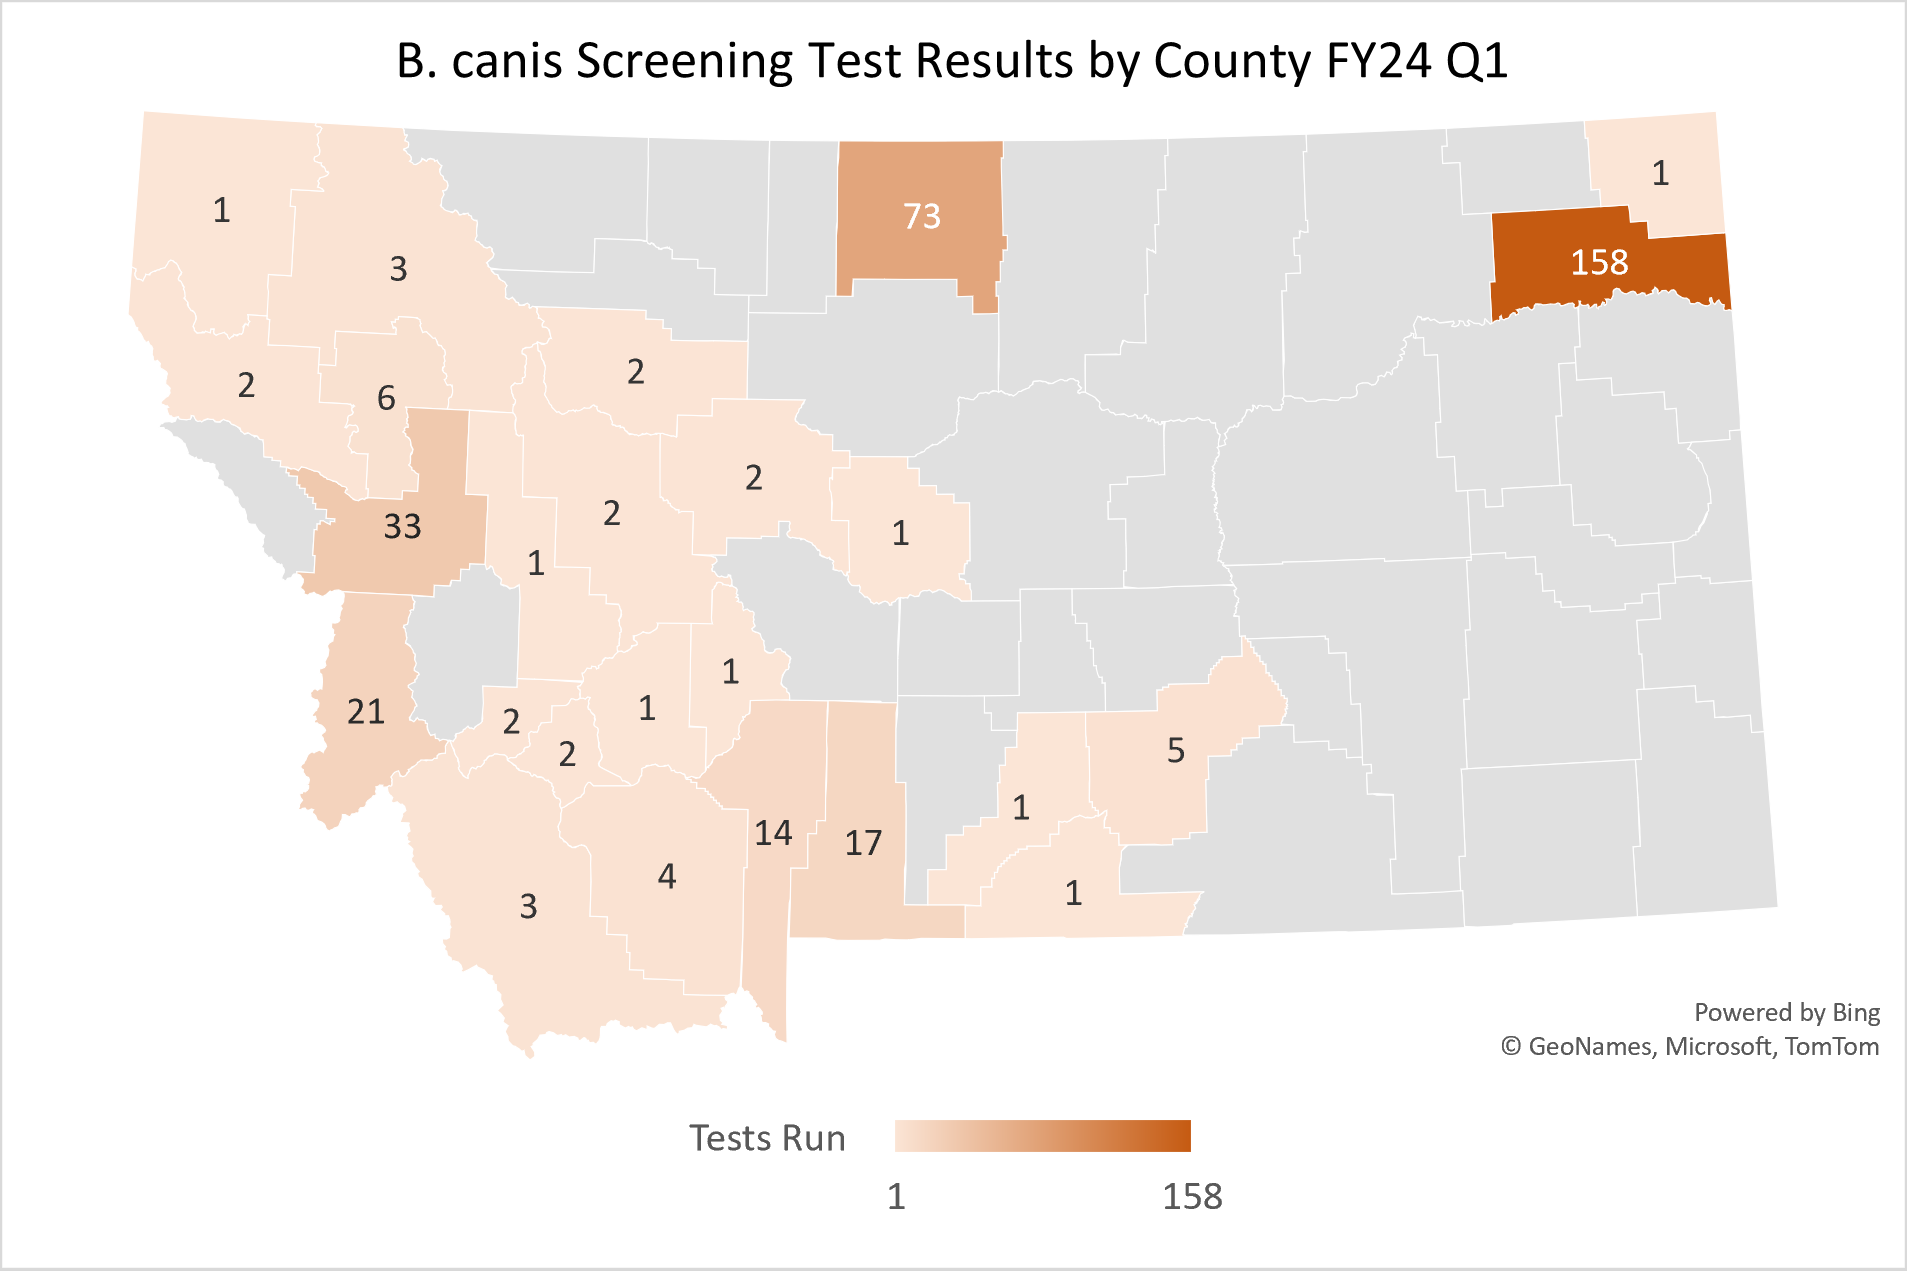
The map above illustrates the distribution of total B. canis screening tests conducted by county in FY24 Q1. The map provides a visual representation of testing efforts and may reflect the region's focus on monitoring and controlling the spread of B. canis.

The graph above displays the B. canis test results for shelter versus owned animals over the months of July, August, and September. It compares the number of positive and negative test results between these two groups. This graph demonstrates the significant number of tests that are being performed through shelters. Shelters conducted 235 tests compared to owned animal tests at 125. In other words, shelters accounted for 65% of the testing performed in Q1. The Department of Livestock recommends that shelter animals that have one of the designated risk factors be tested prior to adoption.
Historical Montana Brucella Canis (B. canis) Testing FY17-FY23
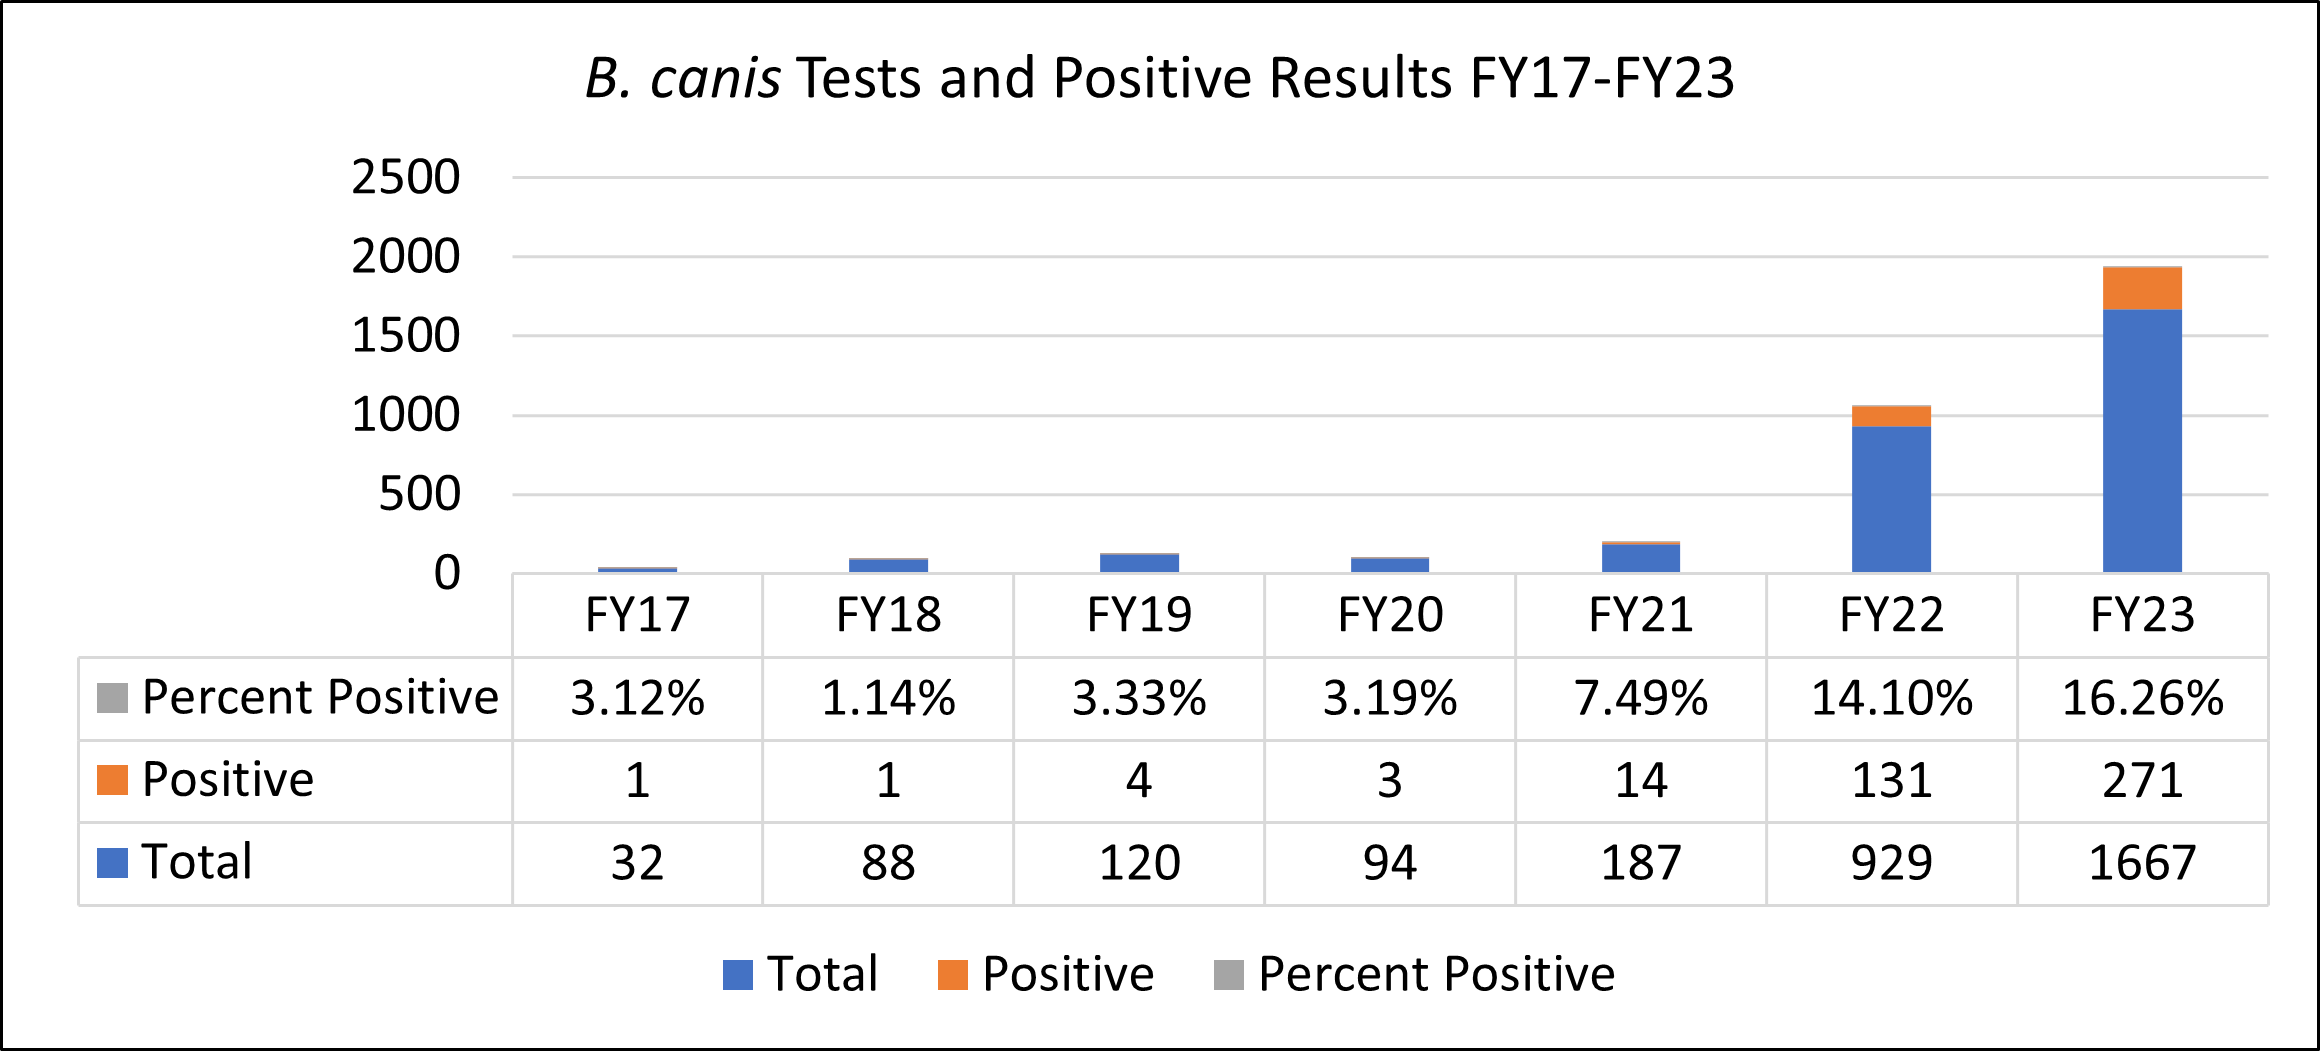
The graph above shows a steady increase in both the total number of tests conducted and the number of positive results over this period. The percentage of positive results has also risen year over year, with a notable jump in FY21 after DOL requested increased surveillance due to concerns over increasing numbers of symptomatic and positive dogs. This trend continued in FY22 and FY23 thanks to support for heightened surveillance by the MT veterinary community. With the enhanced detection efforts, we have also noticed a continued increase in the percent positive rate.
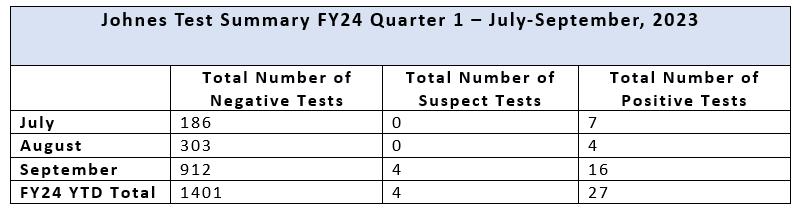
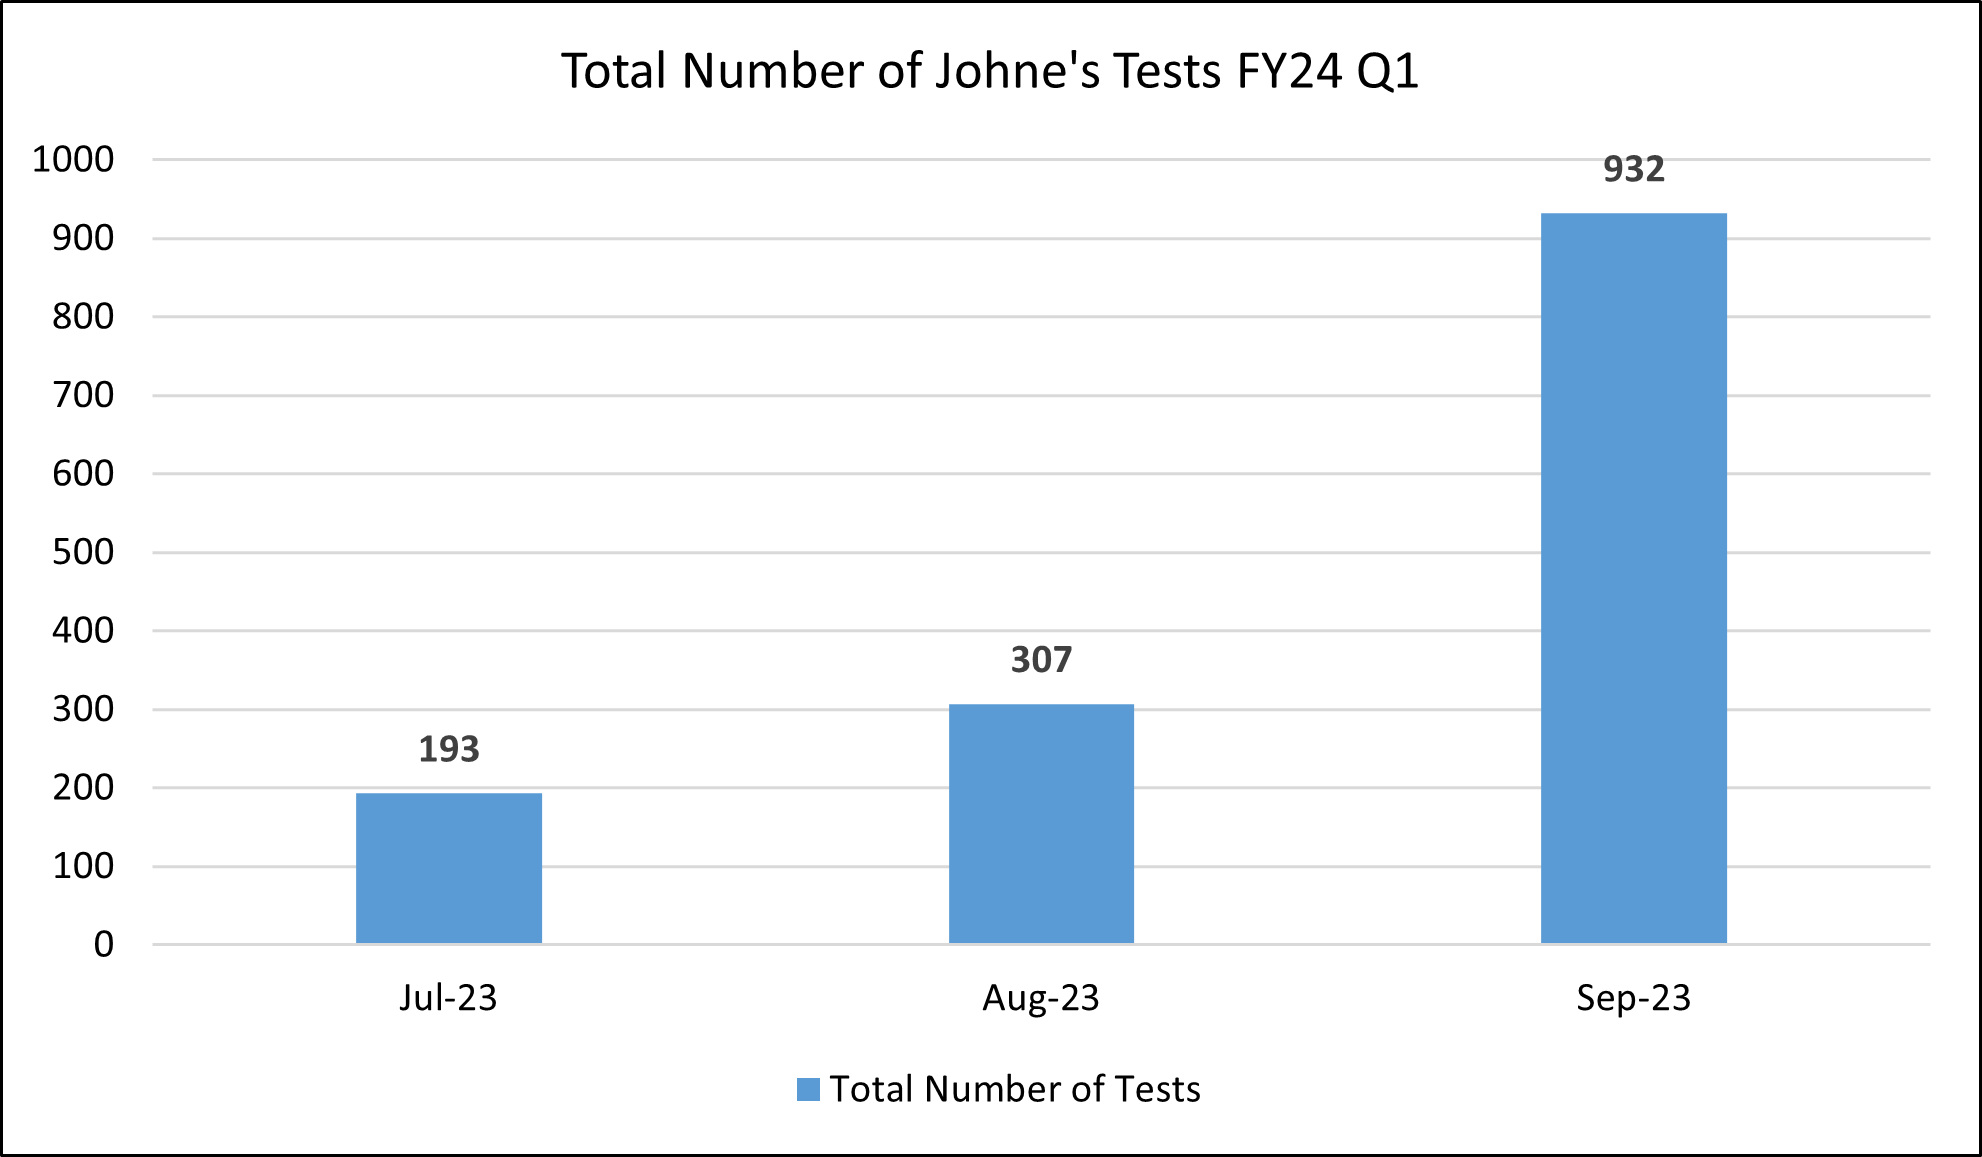


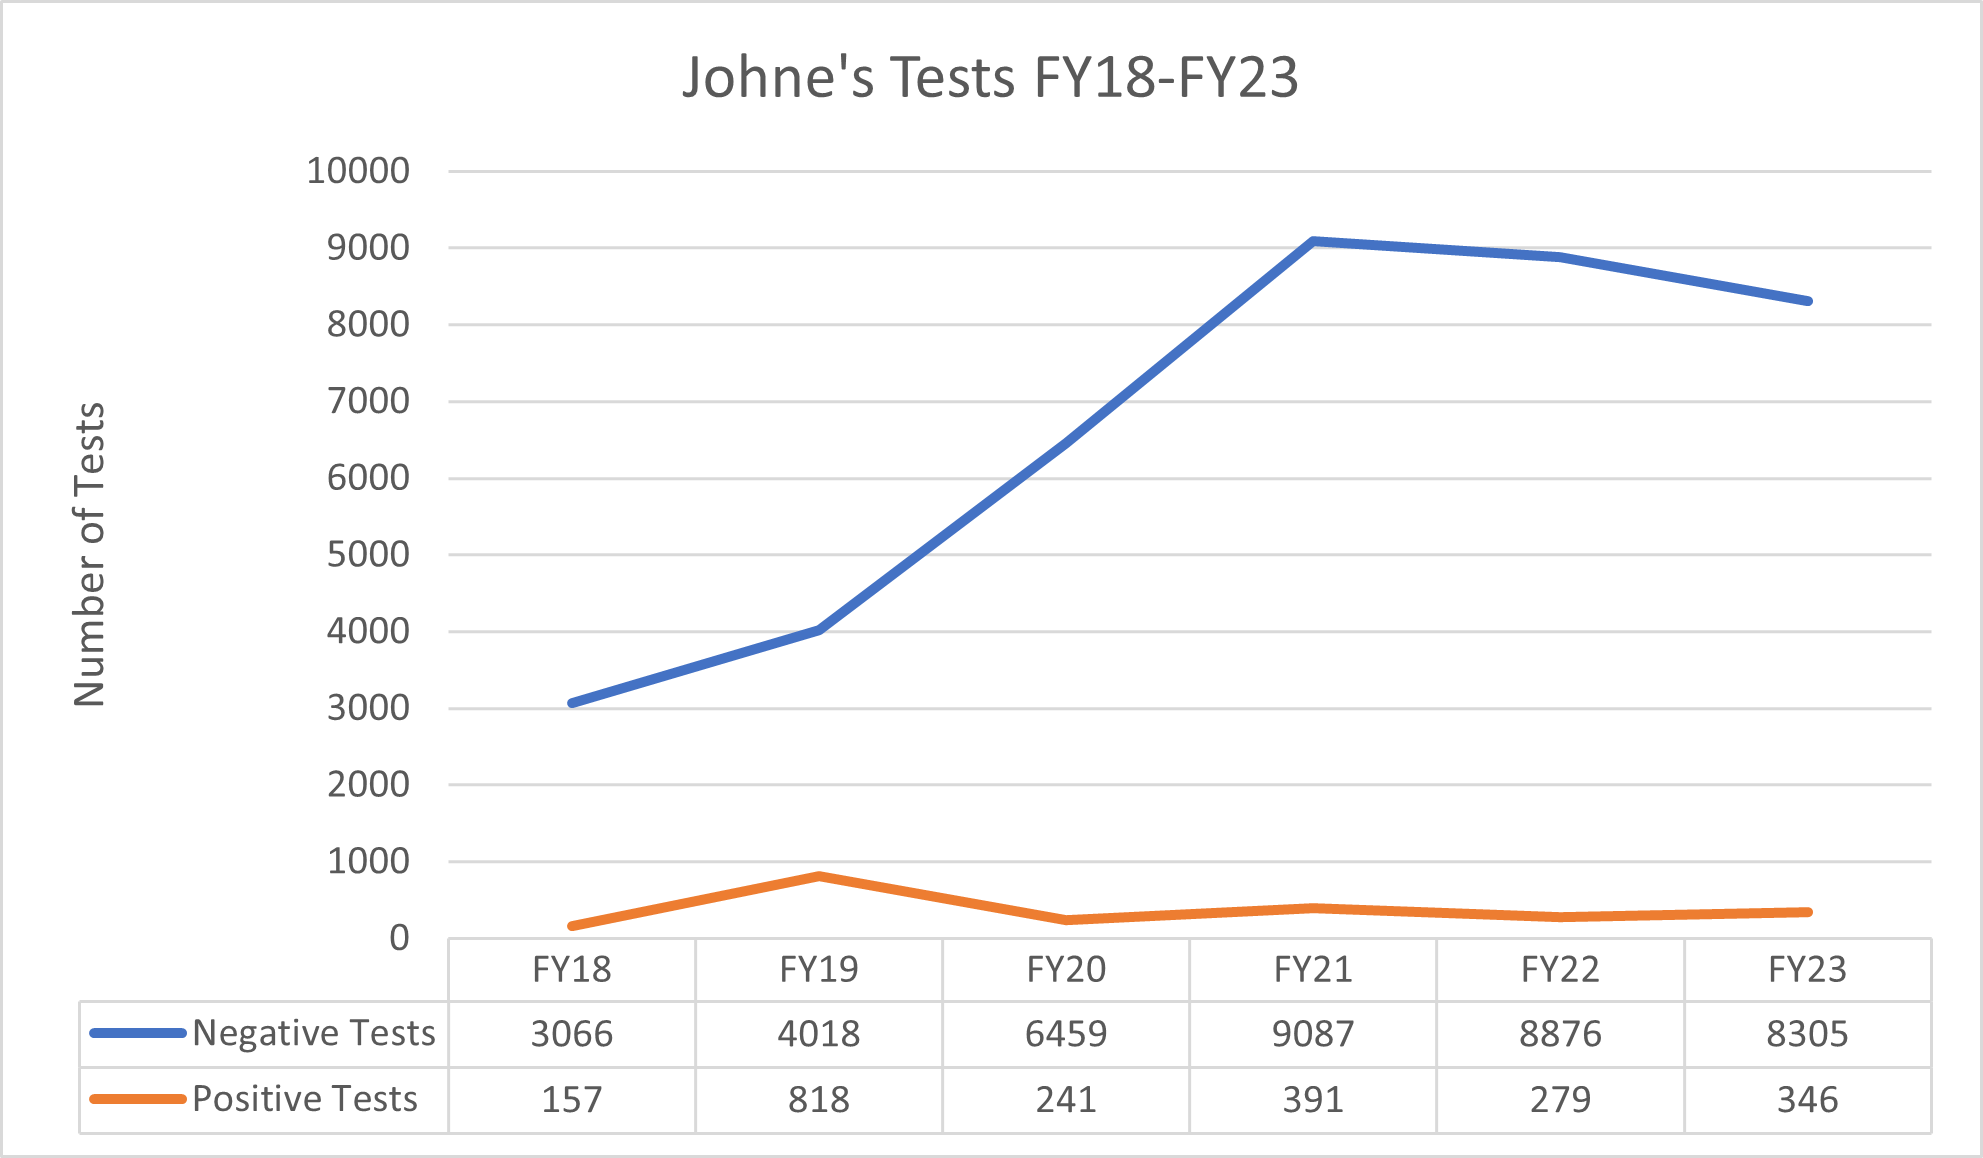
The chart above presents the annual number of Johne's disease tests conducted from FY18 to FY23. The overall number of tests has increased significantly over these years, suggesting enhanced testing efforts, and rising awareness of the disease.
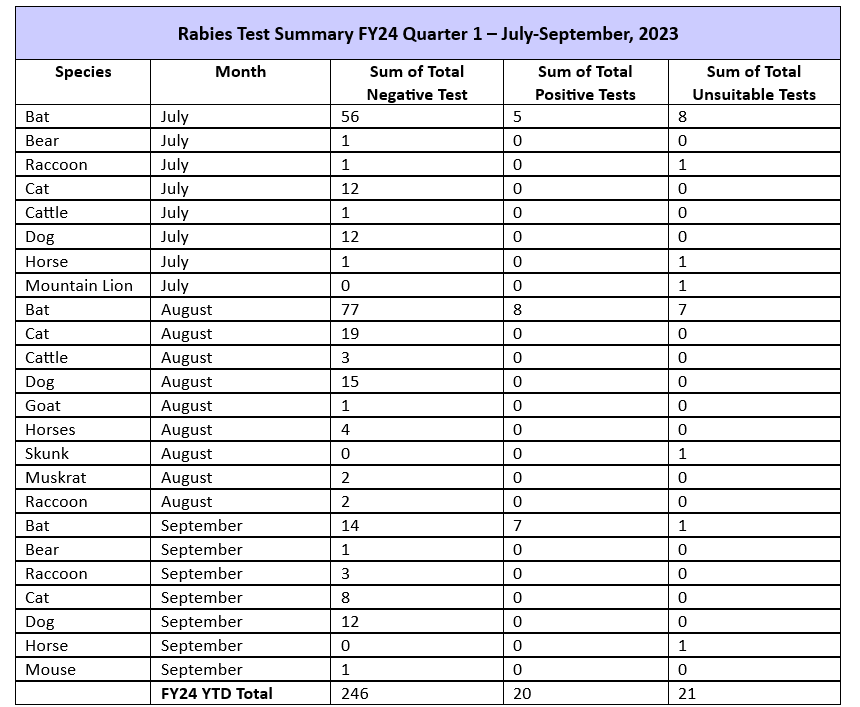

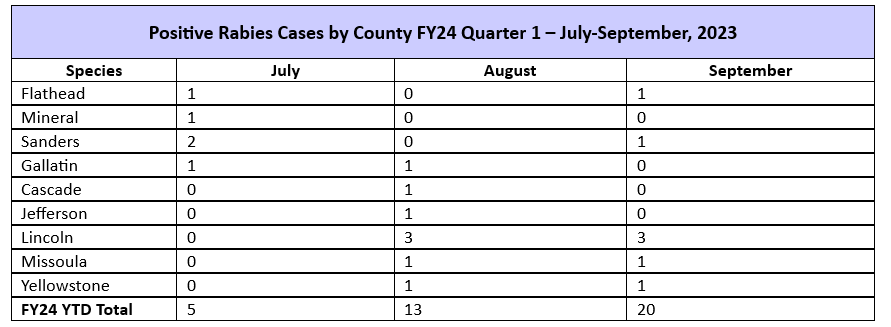

For more information on current rabies quarantines in Montana, and historical rabies test data, please find an interactive Rabies positives by Montana County map here.


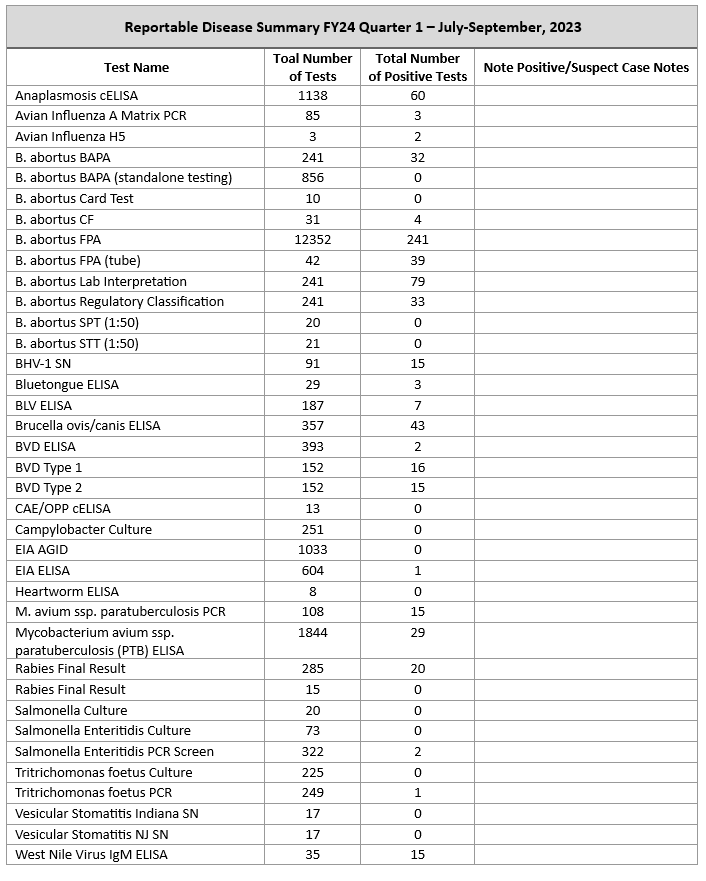
The table below shows testing for other reportable diseases in Montana. Please note, positive test results may not be confirmation of disease depending on the type of test conducted.